주한미대사관
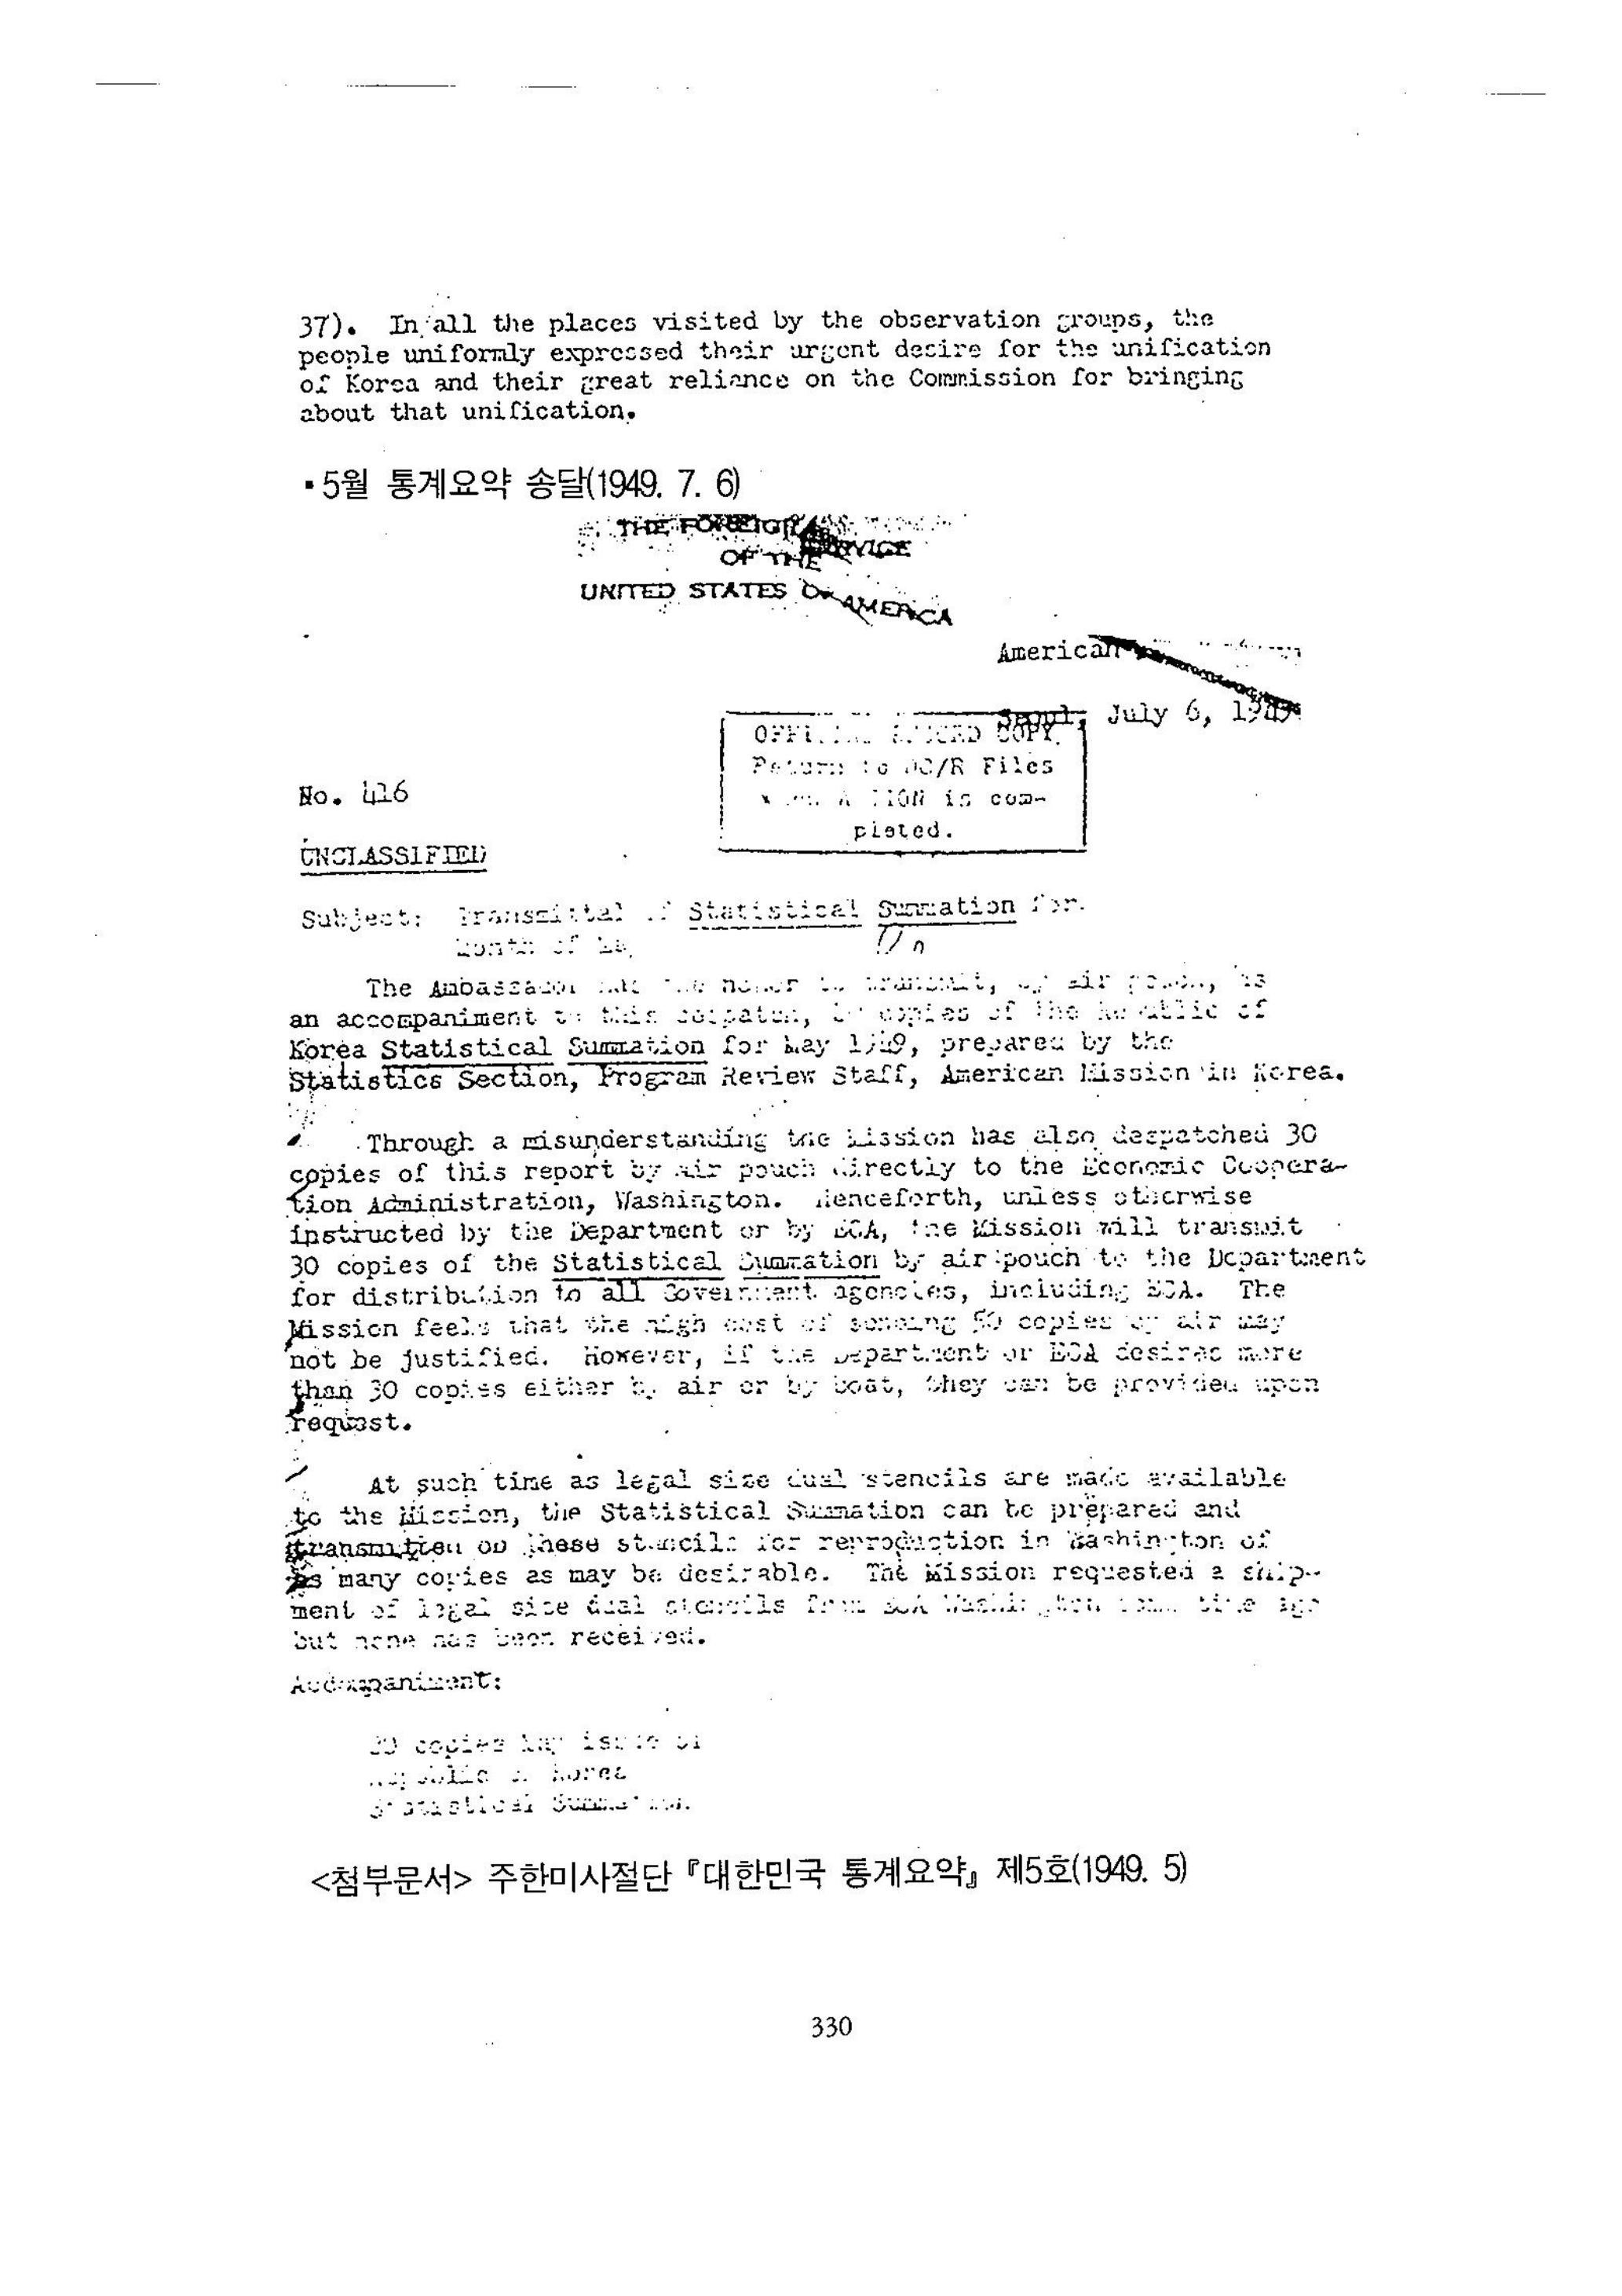
제목: 5월 통계요약 송달
대사는 항공 파우치(외교행랑)편으로 이 <급송문서>와 함께 주한미사절단 기획심사부 통계과가 작성한 1949년 5월의 대한민국 통계요약(Republic of Korea Statistical Summation) 20부를 보내게 돼 영광입니다. 사절단은 또 이 보고서 사본 30부를 항공 행낭편으로 워싱턴의 경제협조처로 직접 급송했습니다.
앞으로 사절단은 국무부나 경제협조처가 다른 지시를 하지 않는 한 경제협조처를 포함한 모든 정부기관 배포용으로 국무부에 항공행낭편으로 통계요약 30부를 보내겠습니다.
사절단은 항공편으로 50부를 보내는 것은 비용이 비싸 정당하지 않다고 생각하고 있습니다. 그러나 국무부나 경제협조처가 항공편이나 선편으로 30부 이상을 원한다면 요구에 따라 할 수 있습니다.
법정 규격 용지의 이중 인쇄용 스텐실이 사절단에게 제공되기 때문에 통계요약은 스텐실 인쇄로 준비돼 보내질 것입니다. 그러면 워싱턴은 원하는 만큼 복사할 수 있을 것입니다.
사절단은 워싱턴의 경제협조처에 법정규격의 이중 인쇄용 스텐실 선적을 요청한 적이 있으나 받지 못했습니다.
첨부문서: 대한민국 통계요약 사본 20부
<첨부문서> 주한미사절단 대한민국 통계요약 제5호 (1949. 7. 6. 보고)
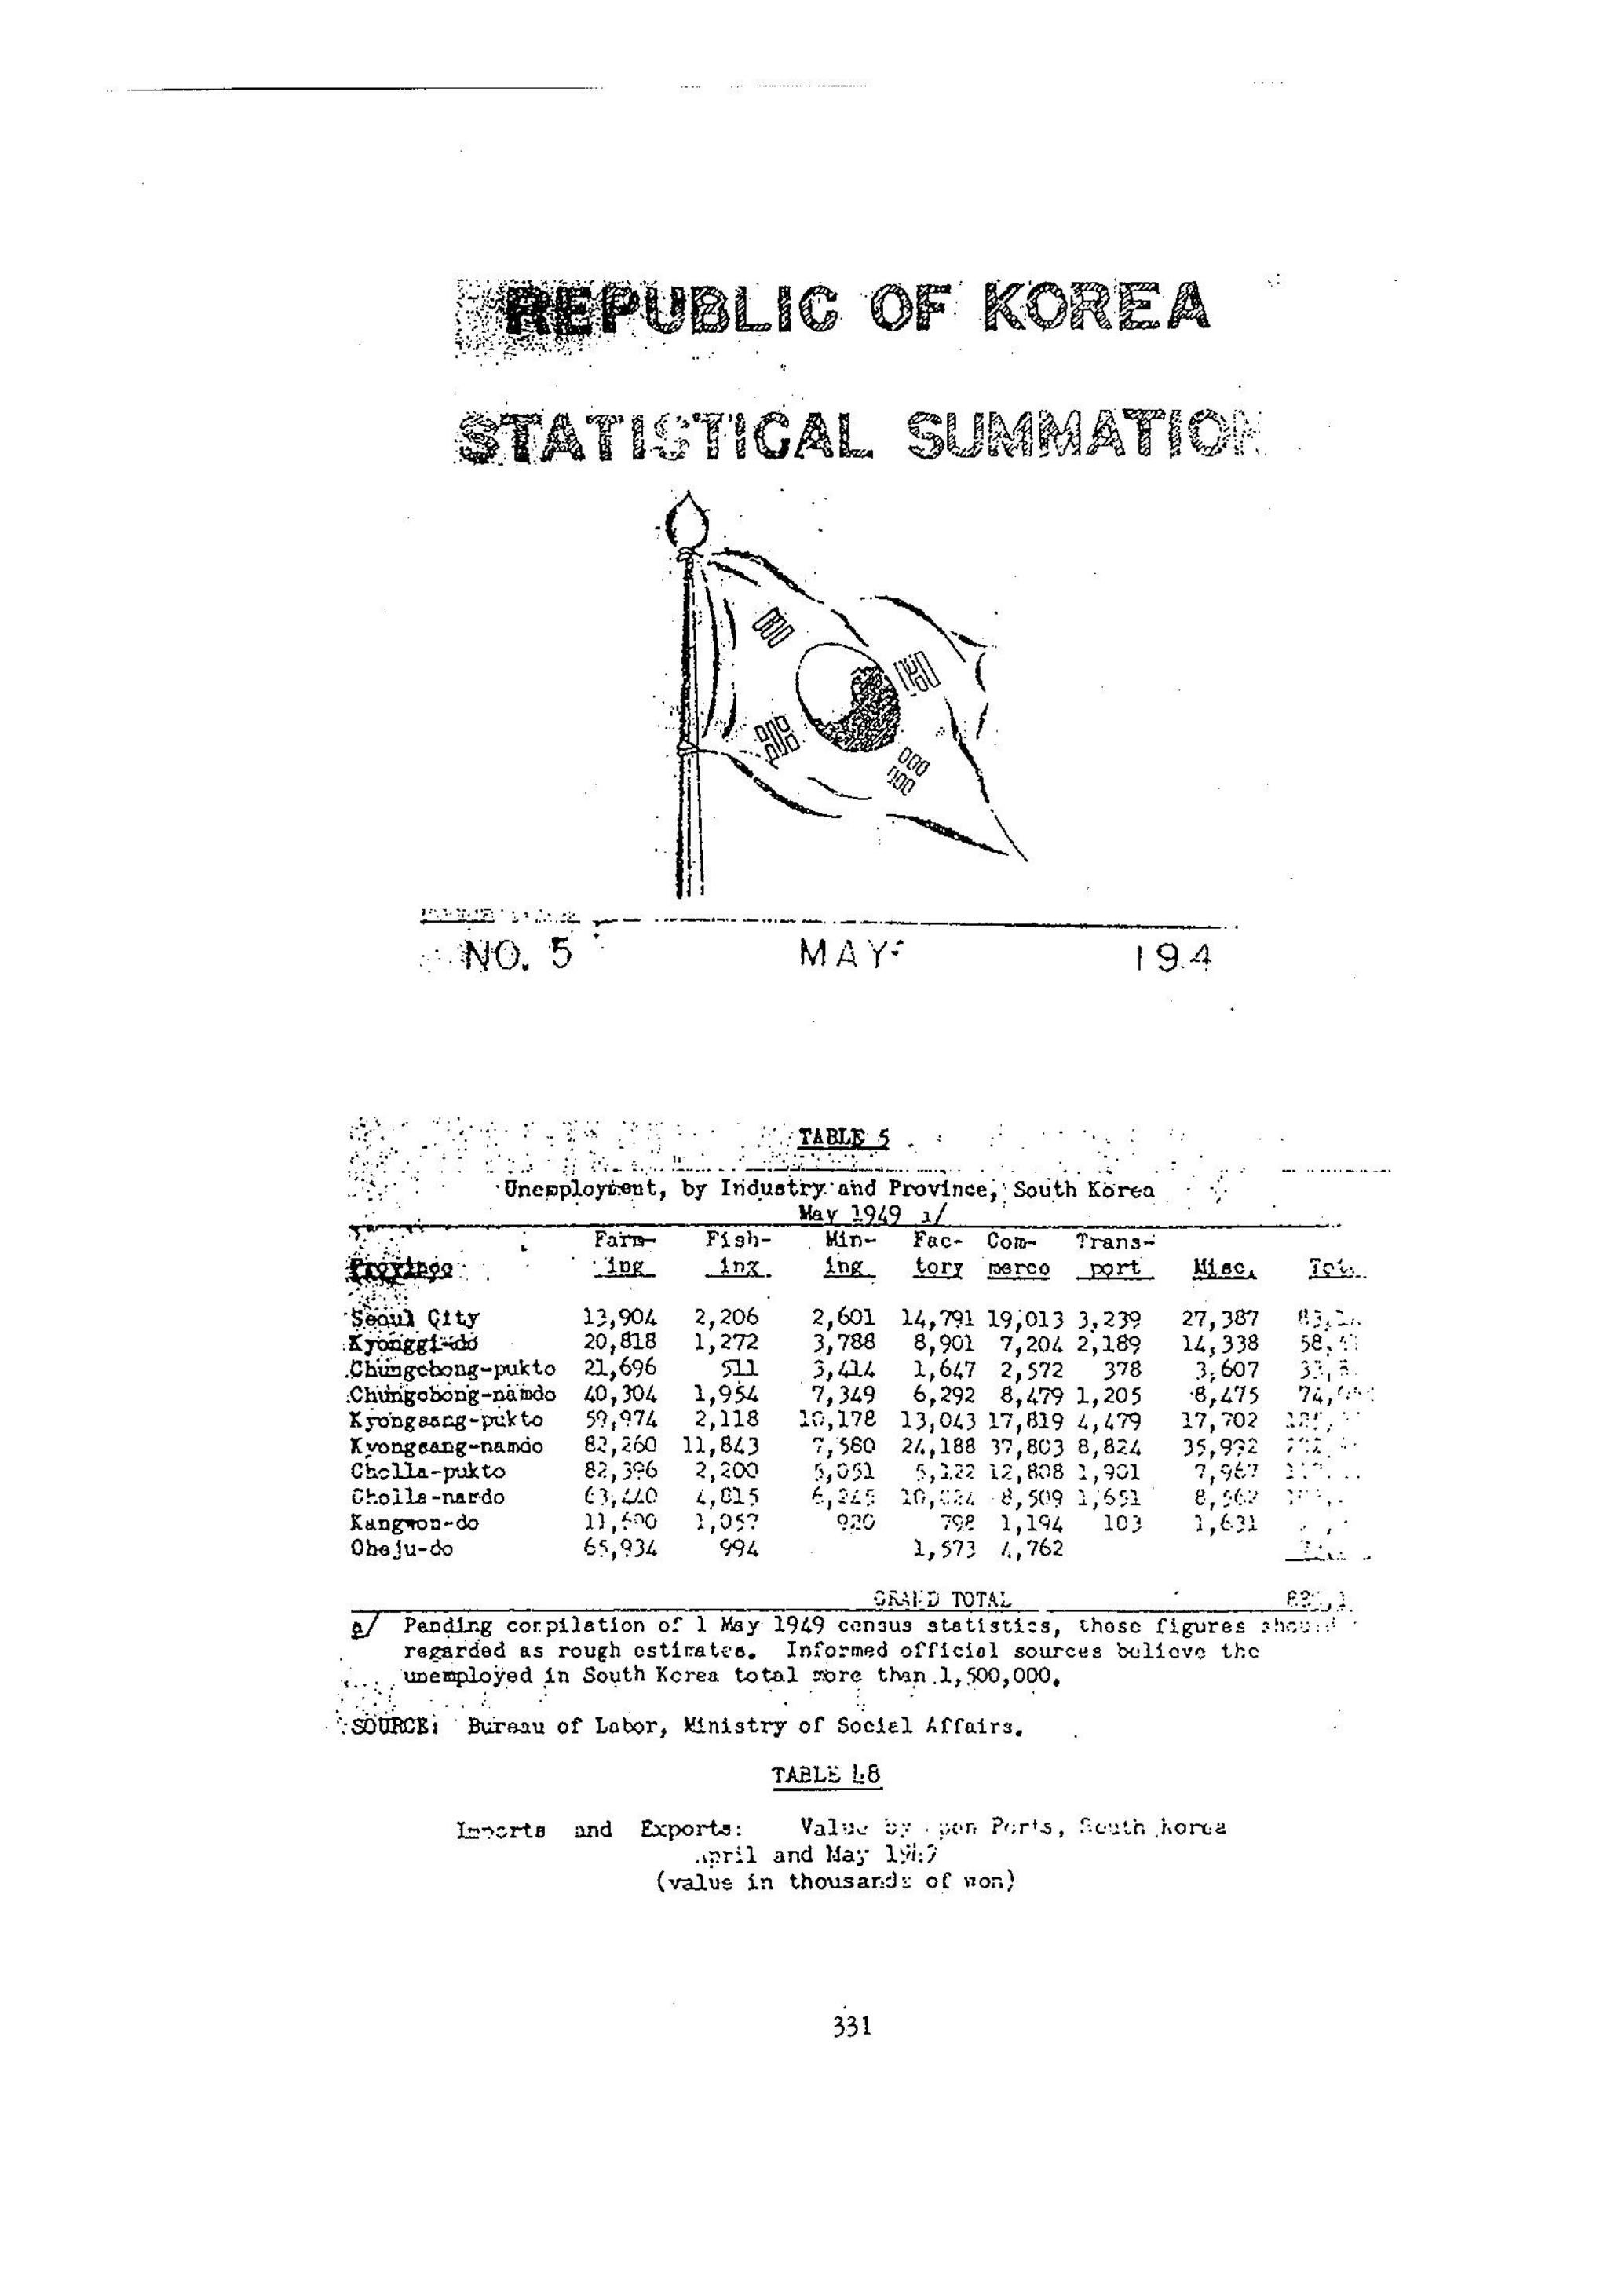
주한미사절단 대한민국 통계요약 제5호, 1949년 5월
표1. 산업별, 도별 실업자 1949년 5월/a
a/ 1949년 5월 1일 현재 편집중에 있기 때문에 이들 추계는 대략 추정치로 간주돼야 한다. 알려진 공식소식 통은 남한의 실업자가 150만 명을 넘을 것으로 믿고 있다.
출처: 사회부 노동국
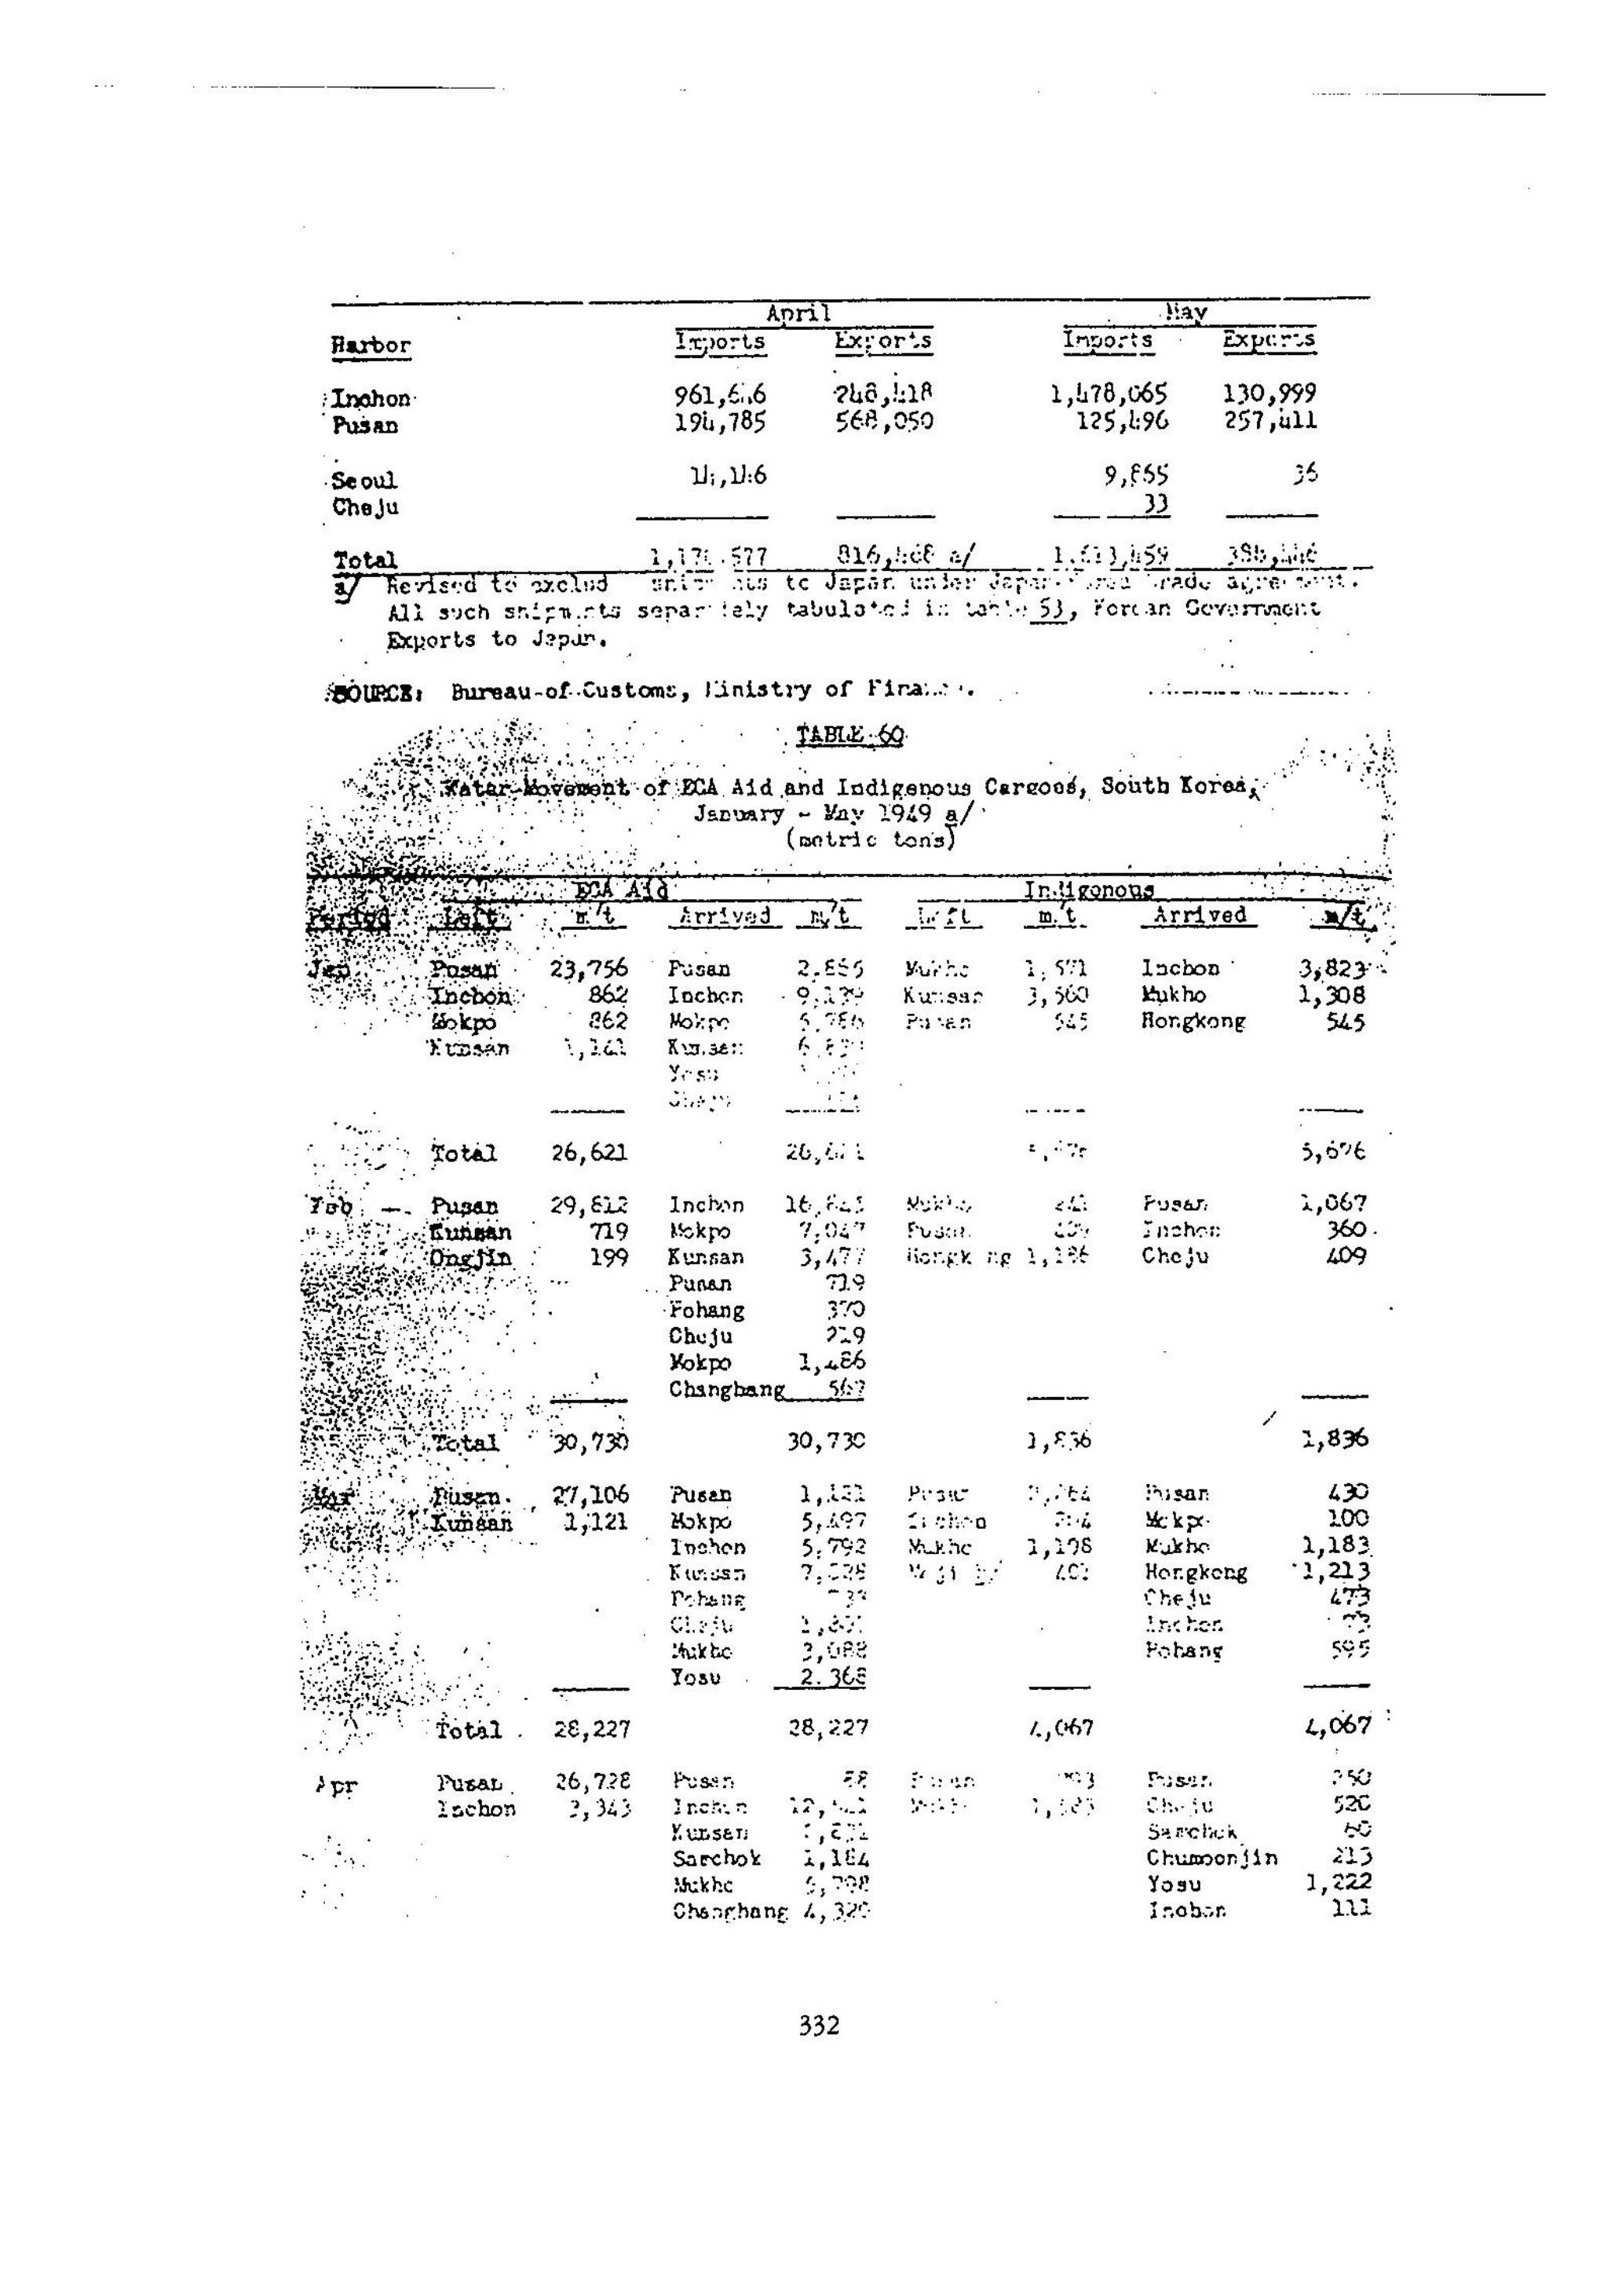
표2. 수출 및 수입: 1949년 4, 5월의 개항장 기준 금액 (가격 1,000원)
a/ 한일무역협정에 따라 일본으로의 선적은 제외하는 것으로 개정됨.
출처: 재무부 관세국
표3. 1949년 1~5월 a/ 경제협조처의 원조와 국내화물(단위: t)
a. 개인 소유의 소형 돛단배를 제외한 모든 상인들의 선적을 포함함.
b. 일본 항구
출처: 운수부 해양국
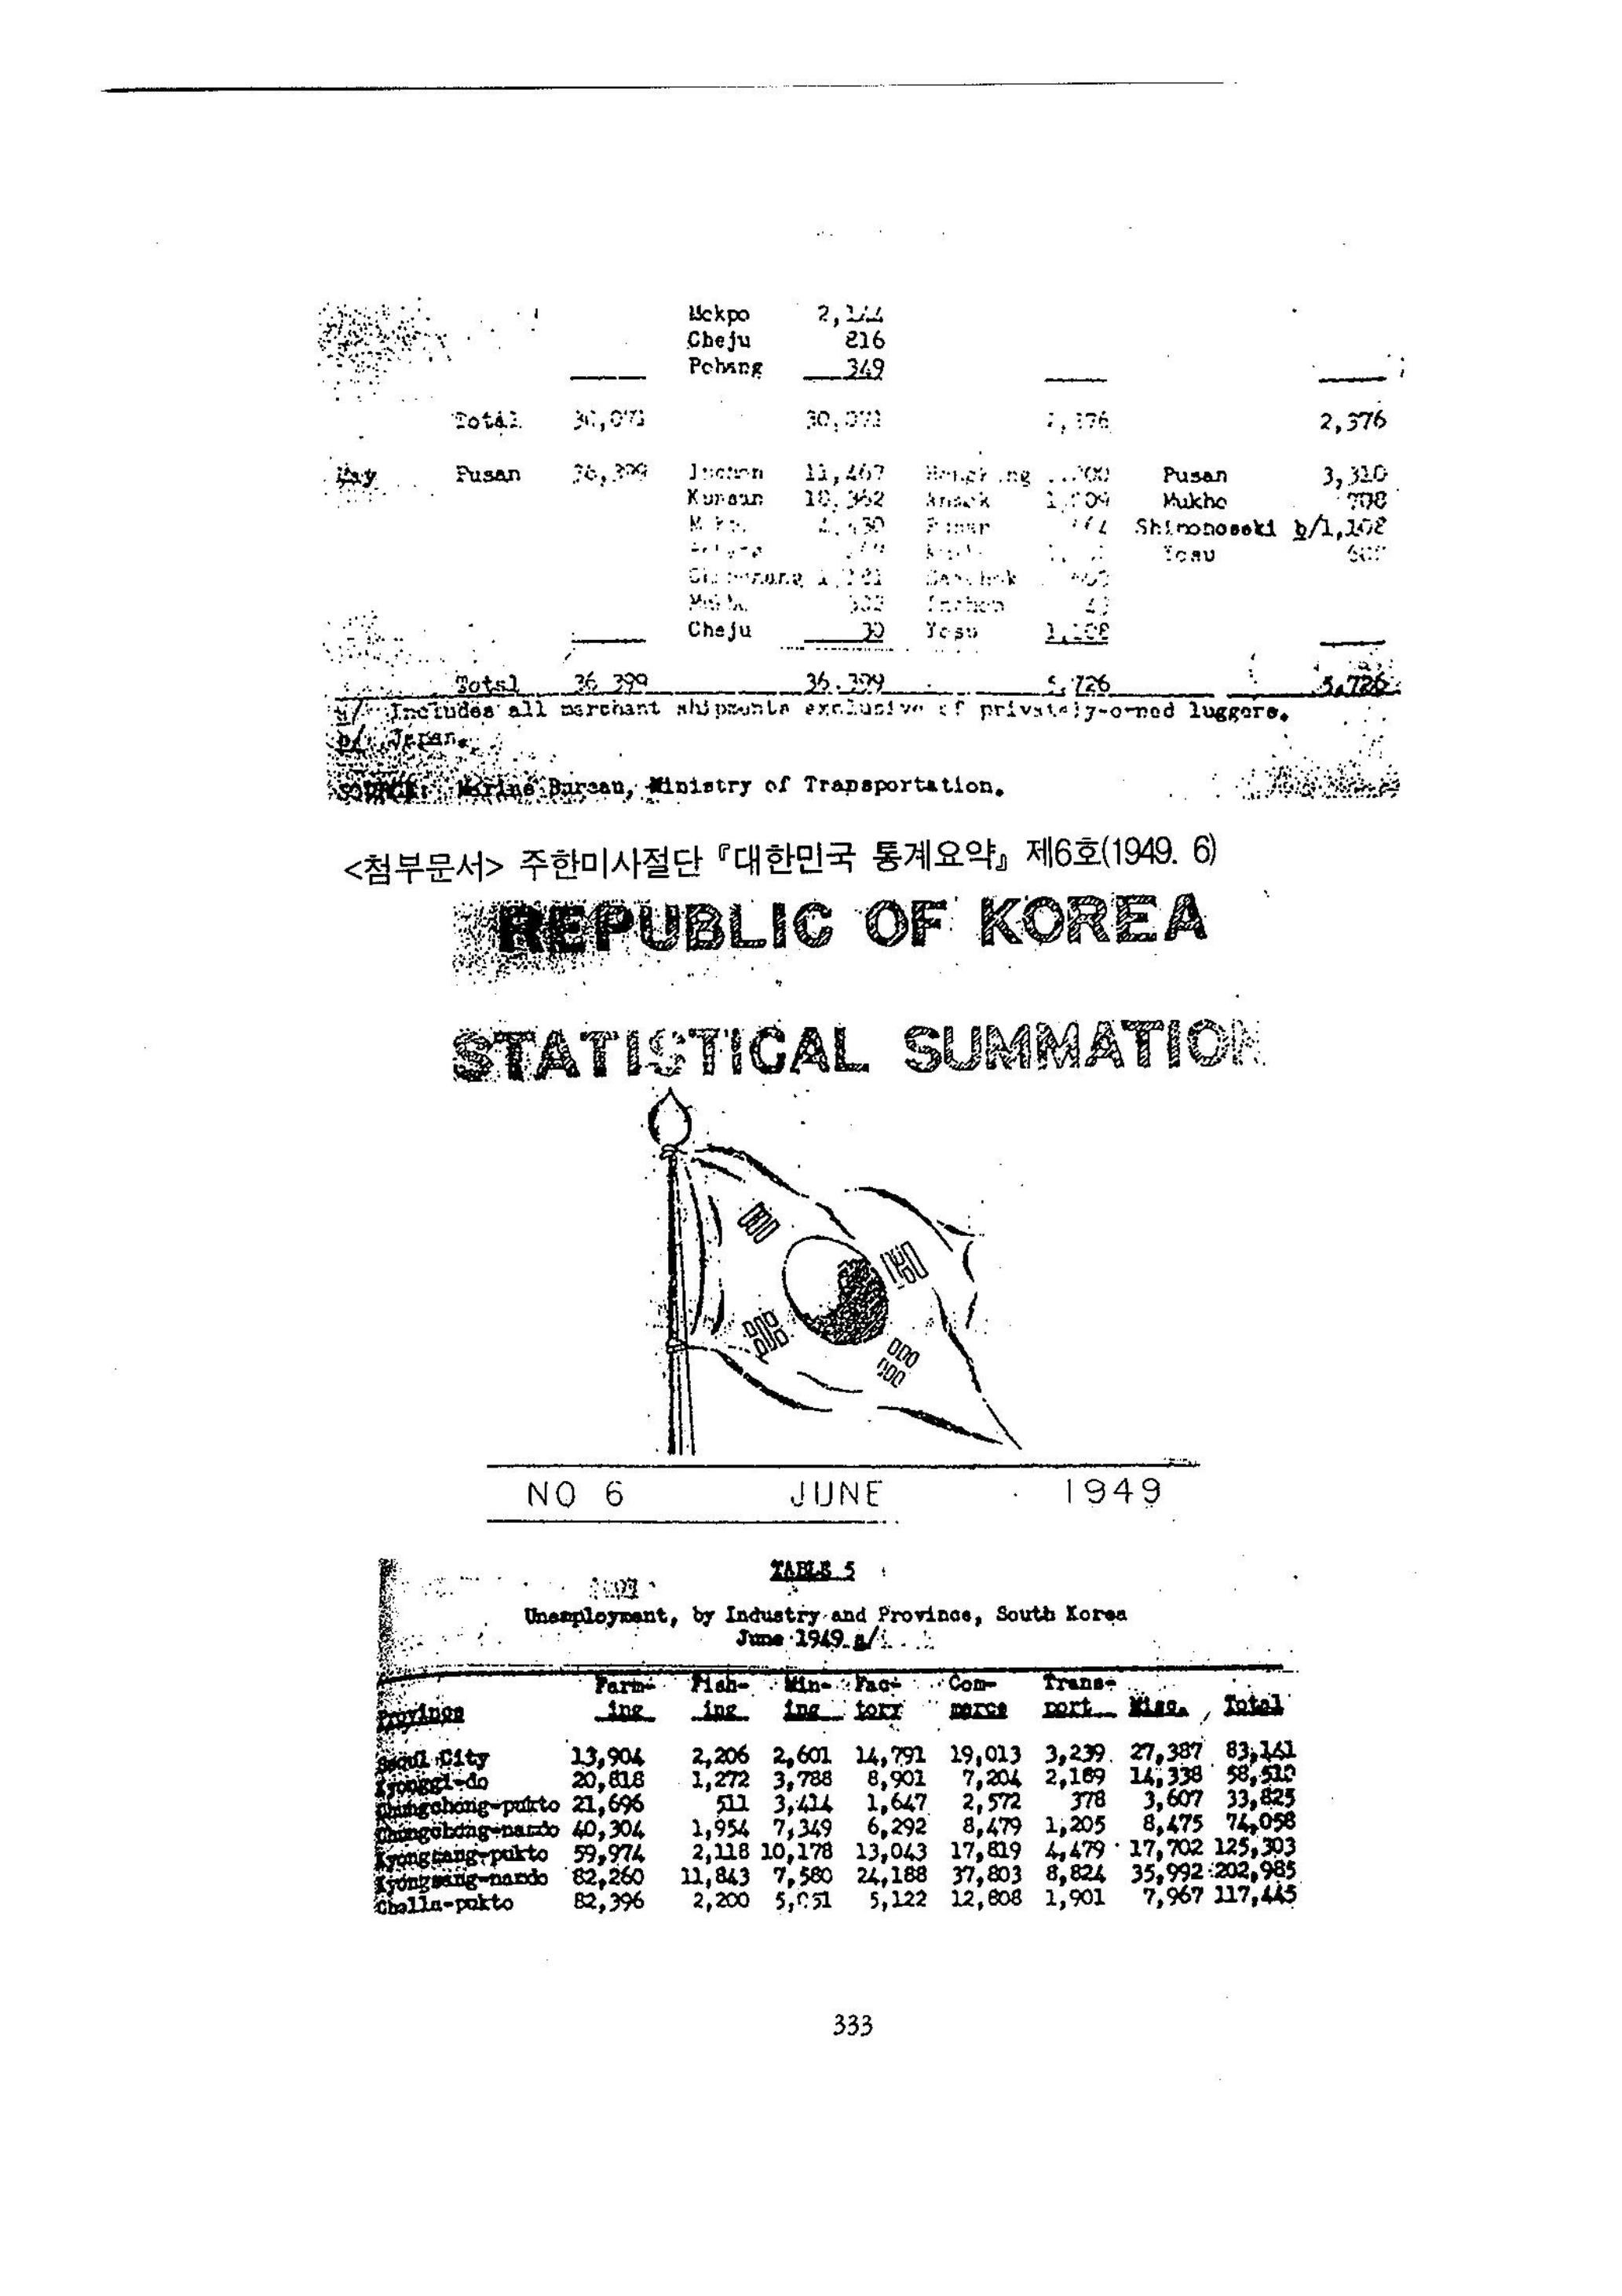
<첨부문서> 주한미사절단 대한민국 통계요약 제6호 (1949. 7. 6 보고)
대한민국 통계요약 제6호, 1949년 6월
주한미사절단
표1. 산업별, 도별 실업자 1949년 6월/a
a/ 1949년 5월 1일 현재 조사통계가 편집중에 있기 때문에 이들 수치는 대략 추정치로 간주돼야 한다. 일부 소식통은 남한의 실업자수가 150만명 이상으로 믿고 있다.
출처: 사회부 노동국
표2. 수출입: 남한의 개항장 기준 금액, 1949년 5~6월 (단위: 1,000원)
출처: 재무부 관세국
표3. 경제협조처 원조와 국내화물의 해로 수송, 1949년 6월 (단위: t)
출처: 운수부 해양국
<첨부문서> 주한미사절단 대한민국 통계요약 제7호 (1949. 7. 6. 보고)
대한민국 통계요약 제7호, 1949년 7월
주한미사절단
표1. 도별 전체 고용 1947년 11월 현재
a/ 이 수치는 학생, 다른 수입에 의지하는 주민, 죄수들은 포함하지 않음.
출처: 공보부 통계국
표2. 도별, 성별, 피난민 상태별 실업자 1949년 4월 현재
a/ 여자 포함.
b/ 사용불가, 상세내역 없음.
출처: 내무부 노동국
표3. 벼 재배면적, 1949년 7월 31일 현재(단위: 정보 a/)
a/ 1정보=2.451에이커
출처: 농림부
표4. 1947~1949년 7월 31일 도별 하곡수집(단위: t)
a/ 1948년 11월 10일 현재 최종 수집량 자료
출처: 대한식량공사(농림부 식량국이 운영하는 기관)
표5. 1946~1949년 5, 6, 7, 8월 강우량(㎜)
출처: 문교부 기상청
표6. 수출입: 개항장 기준 금액, 1949년 6, 7월 (단위: 1,000원)
출처: 재무부 관세국
표7. 1949년 6, 7월 항구별 경제협조처 및 국내화물 해로수송(단위: t)
a/ 일본 항구
출처: 운수부 해양국
THE FOREIGN [illegible]
OF THE
UNITED STATES OF AMERICA
American [illegible]
July 6, 1949
OFFICIAL [illegible] COPY
Return to AC/R Files
[illegible] a tion is completed.
No. 416
UNCLASSIFIED
Subject: Transmittal of Statistical Summation for Month of [illegible].
//n
The Ambassador has the honor to transmit, by air pouch, as an accompaniment to this despatch, 30 copies of the monthly of Korea Statistical Summation for May 1949, prepared by the Statistics Section, Program Review Staff, American Mission in Korea.
Through a misunderstanding the Mission has also despatched 30 copies of this report by air pouch directly to the Economic Cooperation Administration, Washington. Henceforth, unless otherwise instructed by the Department or by ECA, the Mission will transmit 30 copies of the Statistical Summation by air pouch to the Department for distribution to all Government agencies, including ECA. The Mission feels that the high cost of sending 50 copies by air may not be justified. However, if the Department or ECA desire more than 30 copies either by air or by boat, they can be provided upon request.
At such time as legal size dual stencils are made available to the Mission, the Statistical Summation can be prepared and transmitted on these stencils for reproduction in Washington of as many copies as may be desirable. The Mission requested a shipment of legal size dual stencils from [illegible] Washington [illegible] [illegible] but none has been received.
Accompaniment:
30 copies May issue of
[illegible] [illegible] in Korea
of Statistical Summation.
<첨부문서> 주한미사절단 『대한민국 통계요약』 제5호(1949. 5)
REPUBLIC OF KOREA
STATISTICAL SUMMATION
NO. 5 MAY 194
TABLE 5
Unemployment, by Industry and Province, South Korea
May 1949 a/
Province Farm-ing Fish-inx. Min-ing Fac-tory Com-merce Trans-port Misc. Tot.
Seoul City 13,904 2,206 2,601 14,791 19,013 3,239 27,387 83,[illegible]
Kyonggi-do 20,818 1,272 3,788 8,901 7,204 2,189 14,338 58,[illegible]
Chungchong-pukto 21,696 511 3,414 1,647 2,572 378 3,607 33,8
Chungchong-namdo 40,304 1,954 7,349 6,292 8,479 1,205 8,475 74,[illegible]
Kyongsang-pukto 59,974 2,118 10,178 13,043 17,819 4,479 17,702 [illegible]
Kyongsang-namdo 82,260 11,843 7,580 24,188 37,803 8,824 35,932 [illegible]
Cholla-pukto 82,396 2,200 5,051 5,122 12,808 1,901 7,967 [illegible]
Cholla-nardo 63,440 4,815 6,245 10,024 8,509 1,651 8,062 [illegible]
Kangwon-do 11,500 1,057 920 798 1,194 103 1,631 [illegible]
Cheju-do 65,934 994 1,573 4,762 [illegible]
GRAND TOTAL 89[illegible]
a/ Pending compilation of 1 May 1949 census statistics, those figures should be regarded as rough estimates. Informed official sources believe the unemployed in South Korea total more than 1,500,000.
SOURCE: Bureau of Labor, Ministry of Social Affairs.
TABLE 4.8
Imports and Exports: Value by open Ports, South Korea
April and May 1947
(value in thousands of won)
| | April | | May | |
|---|---|---|---|---|
| Harbor | Imports | Exports | Imports | Exports |
| Inchon | 961,6.6 | 248,418 | 1,478,065 | 130,999 |
| Pusan | 194,785 | 568,050 | 125,496 | 257,411 |
| Seoul | 14,146 | | 9,855 | 36 |
| CheJu | | | 33 | |
| Total | 1,170,577 | 816,468 a/ | 1,613,459 | 388,446 |
a/ Revised to exclud units to Japan under Japan trade agree ment.
All such shipments separately tabulated in table 53, Korean Government
Exports to Japan.
SOURCE: Bureau of Customs, Ministry of Finance.
TABLE 60
Inter-Movement of ECA Aid and Indigenous Cargoes, South Korea,
January - May 1949 a/
(metric tons)
| | | ECA Aid | | | Indigenous | | |
|---|---|---|---|---|---|---|---|
| | m/t | Arrived | m/t | w/fl | m.t | Arrived | m/t |
| Jan | Pusan | 23,756 | Pusan | 2,859 | Mukho | 1,571 | Inchon | 3,823 |
| | Inchon | 862 | Inchon | 9,179 | Kunsan | 3,960 | Mukho | 1,308 |
| | Mokpo | 862 | Mokpo | 5,789 | Pusan | 545 | Hongkong | 545 |
| | Kunsan | 1,141 | Kunsan | 6,873 | | | | |
| | | | Yosu | | | | | |
| | | | Cheju | | | | | |
| | Total | 26,621 | | 26,601 | | 6,076 | | 5,676 |
| Feb | Pusan | 29,612 | Inchon | 16,641 | Mukho | 44 | Pusan | 1,067 |
| | Kunsan | 719 | Mokpo | 7,047 | Pusan | 496 | Inchon | 360 |
| | Ongjin | 199 | Kunsan | 3,477 | Hongkong | 1,196 | CheJu | 409 |
| | | | Punan | 719 | | | | |
| | | | Pohang | 370 | | | | |
| | | | CheJu | 209 | | | | |
| | | | Mokpo | 1,486 | | | | |
| | | | Changbang | 567 | | | | |
| | Total | 30,730 | | 30,730 | | 1,836 | | 1,836 |
| Mar | Pusan | 27,106 | Pusan | 1,131 | Pusan | [illegible] | Pusan | 430 |
| | Kunsan | 1,121 | Mokpo | 5,497 | Inchon | [illegible] | Mokpo | 100 |
| | | | Inchon | 5,792 | Mukho | 2,198 | Mukho | 1,183 |
| | | | Kunsan | 7,278 | [illegible] | 401 | Hongkong | 1,213 |
| | | | Pohang | 339 | | | CheJu | 473 |
| | | | Cheju | 1,832 | | | Inchon | [illegible] |
| | | | Mukho | 3,098 | | | Pohang | 595 |
| | | | Yosu | 2,365 | | | | |
| | Total | 28,227 | | 28,227 | | 4,067 | | 4,067 |
| Apr | Pusan | 26,728 | Pusan | 88 | Pusan | [illegible] | Pusan | 750 |
| | Inchon | 3,343 | Inchon | 17,[illegible] | [illegible] | 1,489 | CheJu | 520 |
| | | | Kunsan | 1,671 | | | Sarchok | 60 |
| | | | Sarchok | 1,184 | | | Chumoonjin | 213 |
| | | | Mukho | 5,798 | | | Yosu | 1,222 |
| | | | Changchang | 4,320 | | | Inchon | 111 |
Mokpo 2,144
Cheju 216
Pohang 349
Total 30,073 30,371 7,176 2,576
Bay Pusan 36,399 Inchon 11,467 Honger ng [illegible] Pusan 3,310
Kunsan 10,362 Ansack 1,004 Mukho 700
M.P.o. 2,430 Pohur 171 Shimonoseki b/1,106
Lriyo-p 774 khri [illegible] Yosu 607
Ci norung a.131 Sam.bok 402
Moi'a 323 Inchon 43
Cheju 10 Yosu 1,158
Total 36,399 26,379 5,726 5,726
a/ Includes all marchant shipments exclusive of privately-owned luggers.
b/ Japan.
Source: Korean Bureau, Ministry of Transportation.
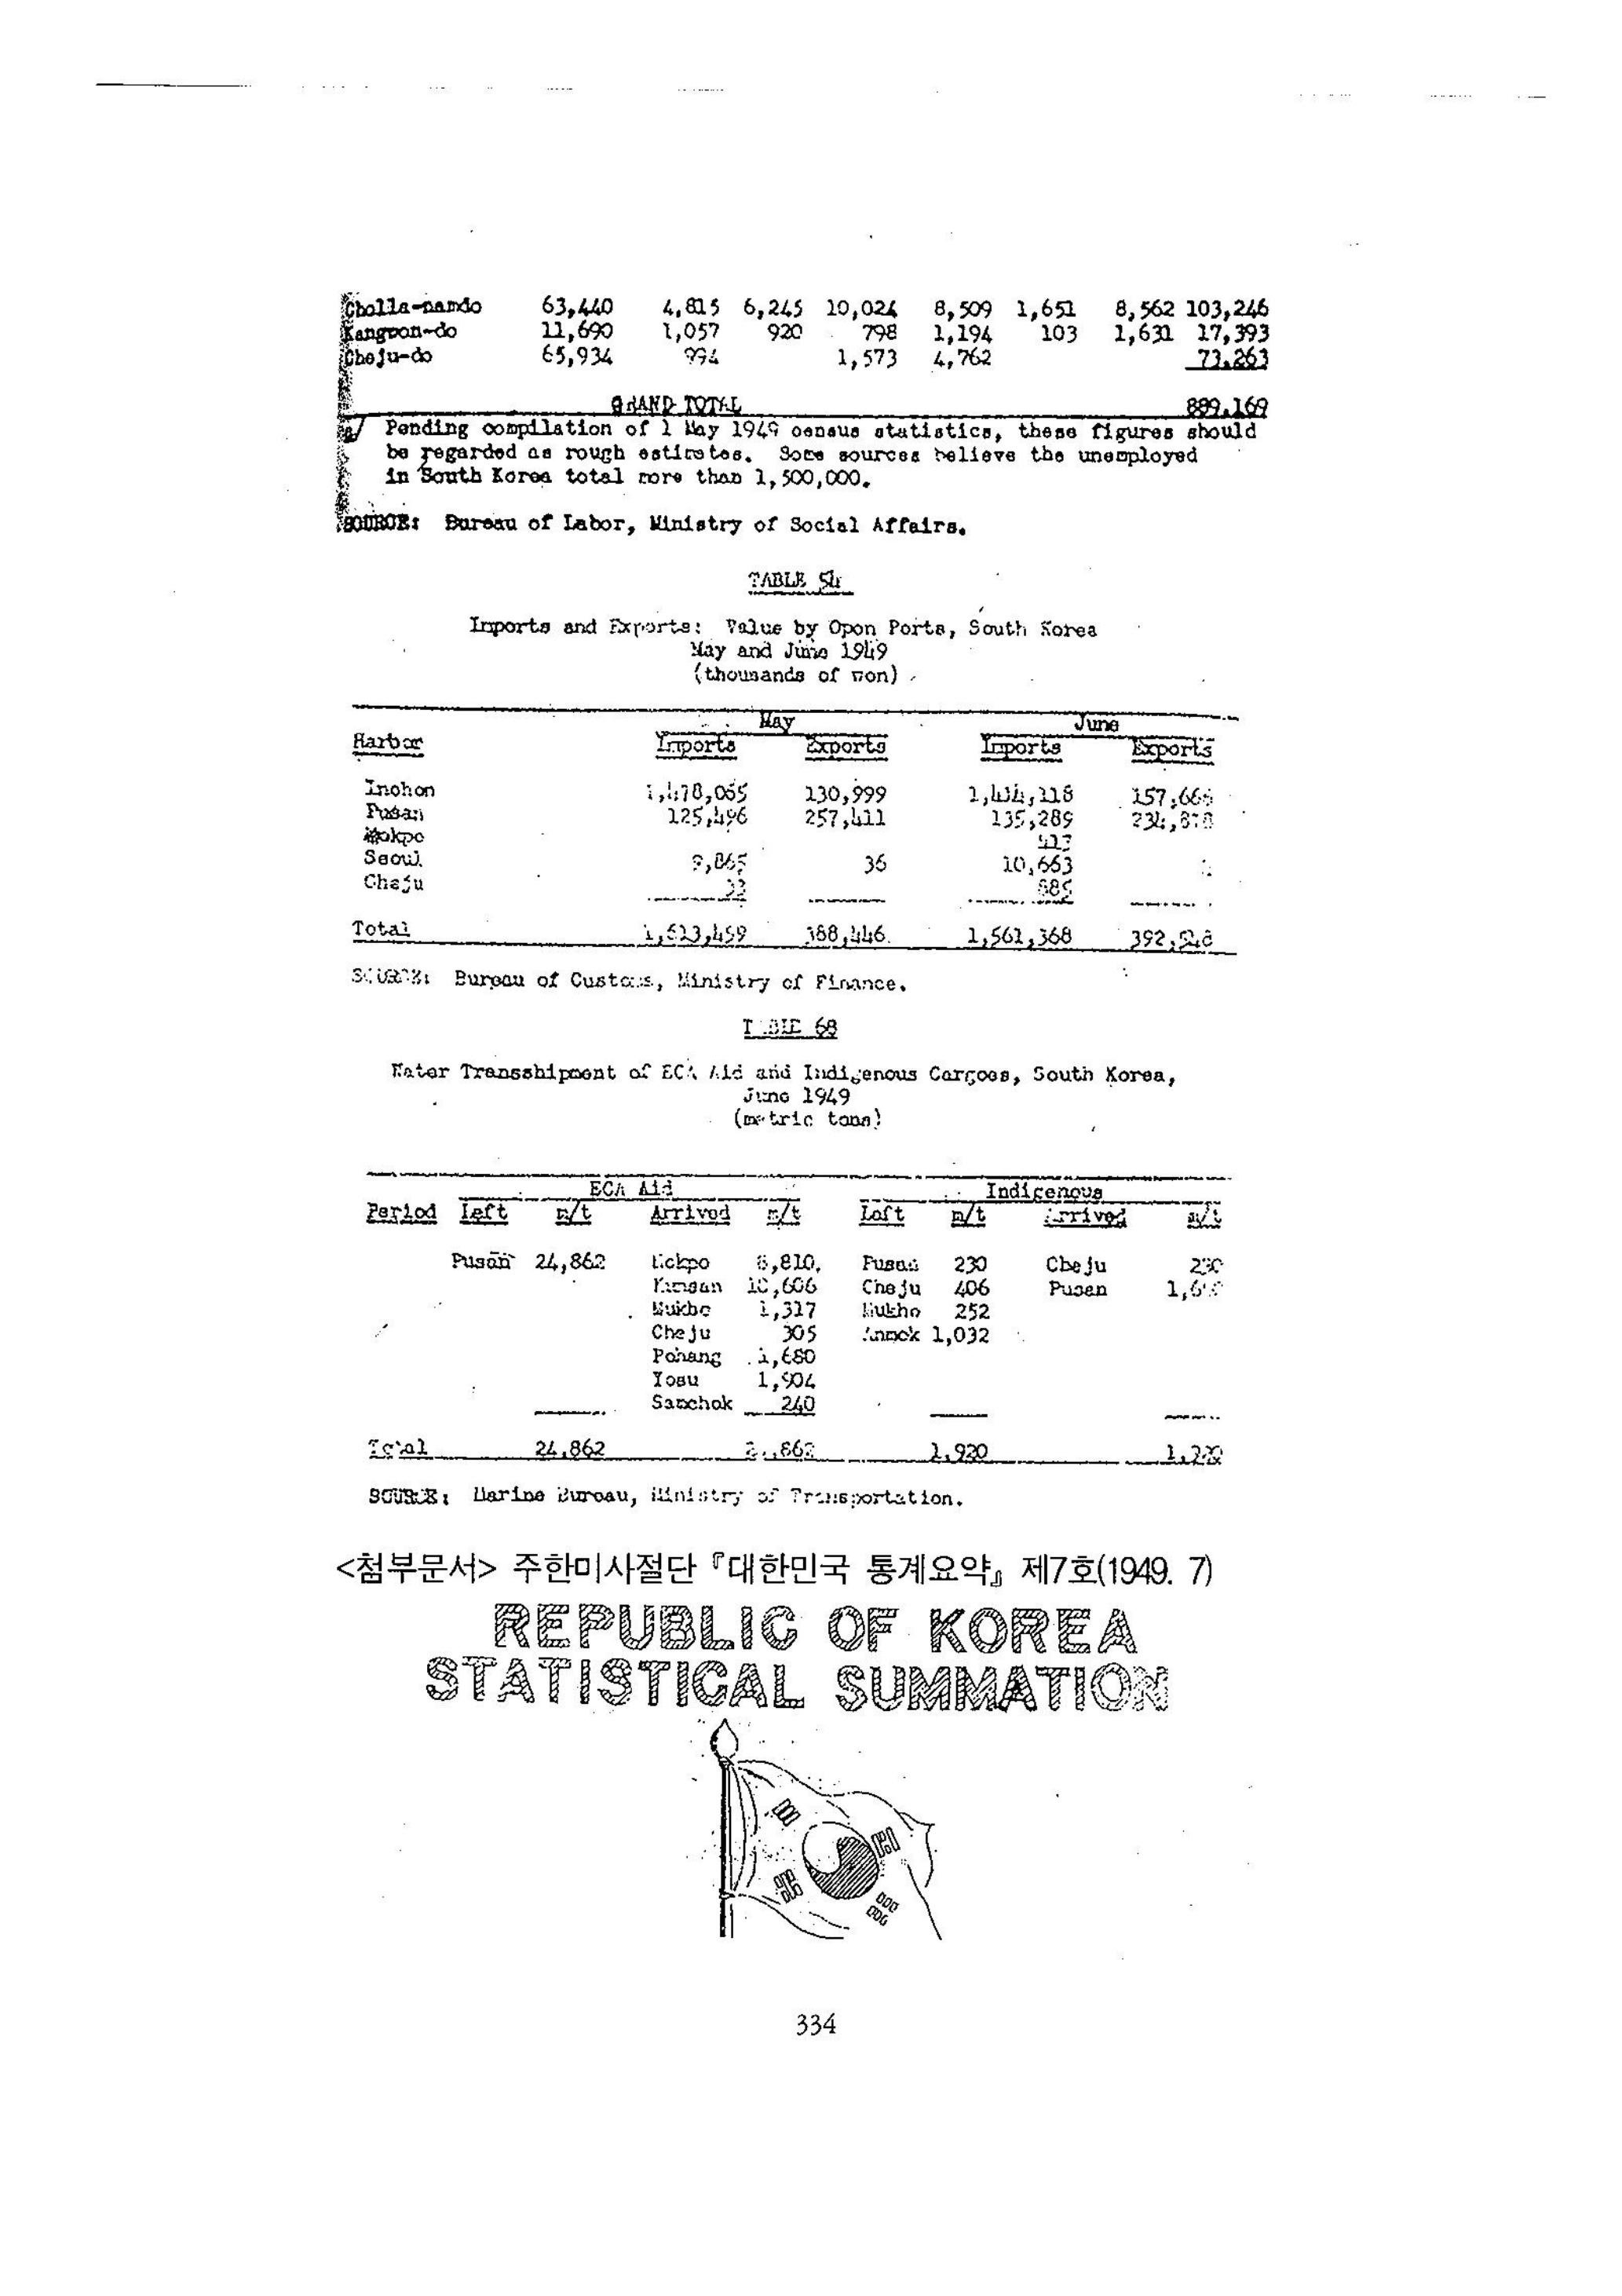
<첨부문서> 주한미사절단 『대한민국 통계요약』 제6호(1949. 6)
REPUBLIC OF KOREA
STATISTICAL SUMMATION
NO 6 JUNE 1949
TABLE 5
Unemployment, by Industry and Province, South Korea
June 1949. a/
Province Farm-ing Fish-ing Min-ing Fac-tory Com-merce Trans-port Misc. Total
Seoul City 13,904 2,206 2,601 14,791 19,013 3,239 27,387 83,141
Kyonggi-do 20,818 1,272 3,788 8,901 7,204 2,169 14,338 58,512
Kangwon-pukto 21,696 511 3,414 1,647 2,572 378 3,607 33,825
Chungchong-namdo 40,304 1,954 7,349 6,292 8,479 1,205 8,475 74,058
Kyongsang-pukto 59,974 2,118 10,178 13,043 17,819 4,479 17,702 125,303
Chonnaing-namdo 82,260 11,843 7,580 24,188 37,803 8,824 35,992 202,985
Cholla-pukto 82,396 2,200 5,051 5,122 12,808 1,901 7,967 117,445
Cholla-namdo 63,440 4,815 6,245 10,024 8,509 1,651 8,562 103,246
Kangwon-do 11,690 1,057 920 798 1,194 103 1,631 17,393
Cheju-do 65,934 994 1,573 4,762 71,263
GRAND TOTAL 889,169
Pending compilation of 1 May 1949 census statistics, these figures should
be regarded as rough estimates. Some sources believe the unemployed
in South Korea total more than 1,500,000.
SOURCE: Bureau of Labor, Ministry of Social Affairs.
TABLE 51
Imports and Exports: Value by Open Ports, South Korea
May and June 1949
(thousands of won)
Harbor May June
Imports Exports Imports Exports
Inchon 1,470,065 130,999 1,414,118 157,665
Pusan 125,496 257,411 135,289 234,810
Mokpo 115
Seoul 9,865 36 10,663
Cheju 33 586
Total 1,613,459 388,446 1,561,368 392,948
SOURCE: Bureau of Customs, Ministry of Finance.
TABLE 68
Water Transshipment of ECA Aid and Indigenous Cargoes, South Korea,
June 1949
(metric tons)
Period Left ECA Aid Indigenous
R/t Arrived R/t Left R/t Arrived R/t
Pusan 24,862 Mokpo 8,810. Pusai 230 Cheju 230
Kunsan 10,606 Cheju 406 Pusan 1,695
Mukho 1,317 Mukho 252
Cheju 305 Annok 1,032
Pohang 1,680
Yosu 1,904
Samchok 240
Total 24,862 24,862 1,920 1,925
SOURCE: Marine Bureau, Ministry of Transportation.
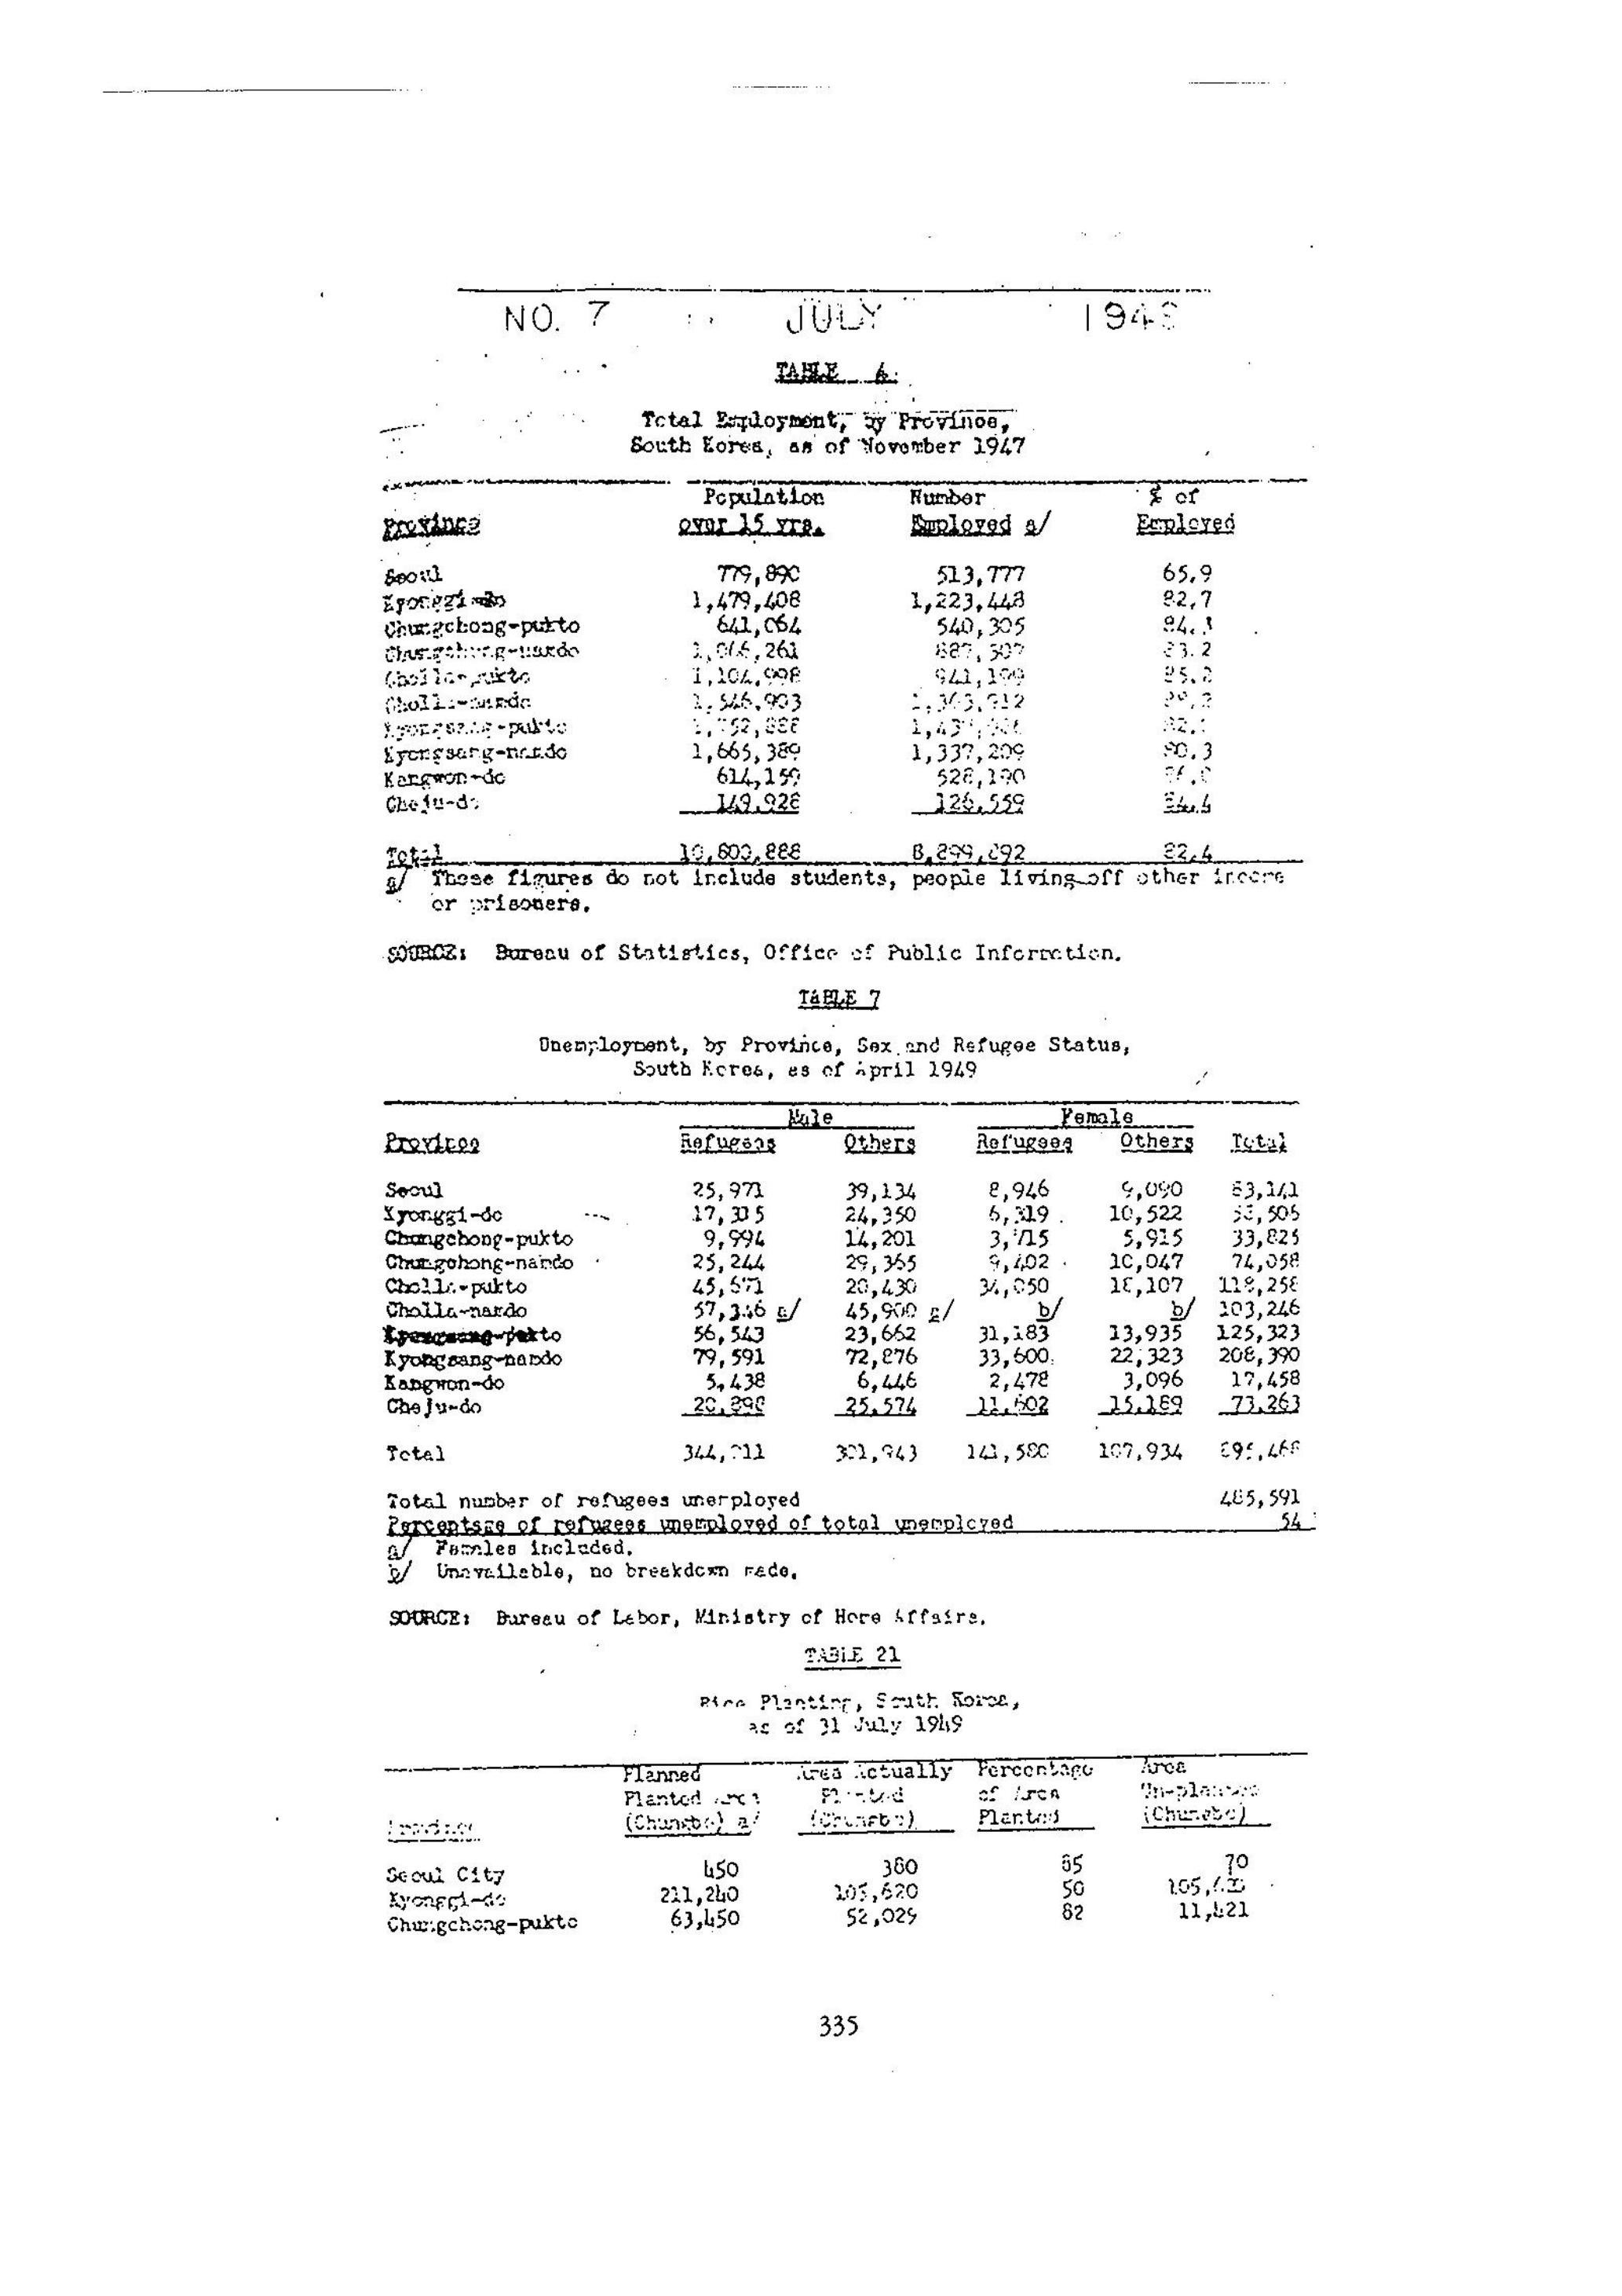
<첨부문서> 주한미사절단 『대한민국 통계요약』 제7호(1949. 7)
REPUBLIC OF KOREA
STATISTICAL SUMMATION
NO. 7 JULY 1949
TABLE 6
Total Employment, by Provinces,
South Korea, as of November 1947
Province Population over 15 yrs. Number Employed a/ % of Employed
Seoul 779,890 513,777 65.9
Kyonggi-do 1,479,408 1,223,448 82.7
Chungchong-pukto 641,064 540,305 84.3
Chungchong-namdo 1,016,261 880,397 83.2
Cholla-pukto 1,104,008 941,109 85.2
Cholla-namdo 1,546,903 1,305,912 80.3
Kyongsang-pukto 1,792,886 1,491,054 83.1
Kyongsang-namdo 1,665,389 1,337,209 80.3
Kangwon-do 614,159 528,190 86.0
Cheju-do 149,928 126,559 84.4
Total 10,803,888 8,893,692 82.4
a/ These figures do not include students, people living off other income
or prisoners.
SOURCE: Bureau of Statistics, Office of Public Information.
TABLE 7
Unemployment, by Province, Sex and Refugee Status,
South Korea, as of April 1949
Province Male Female
Refugees Others Refugees Others Total
Seoul 25,971 39,134 8,946 9,090 83,141
Kyonggi-do 17,115 24,350 6,519 10,522 58,505
Changchong-pukto 9,994 14,201 3,715 5,915 33,825
Chungchong-nando 25,244 29,365 9,402 10,047 74,058
Cholla-pukto 45,571 20,430 34,050 18,107 118,258
Cholla-namdo 57,146 a/ 45,900 a/ b/ b/ 103,246
Kyongsang-pukto 56,543 23,662 31,183 13,935 125,323
Kyongsang-nando 79,591 72,876 33,600 22,323 208,390
Kangwon-do 5,438 6,446 2,478 3,096 17,458
Cheju-do 20,398 25,574 11,602 15,189 73,263
Total 344,711 301,943 141,500 107,934 896,468
Total number of refugees unemployed 465,591
Percentage of refugees unemployed of total unemployed 54
a/ Females included.
b/ Unavailable, no breakdown made.
SOURCE: Bureau of Labor, Ministry of Home Affairs.
TABLE 21
Rice Planting, South Korea,
as of 31 July 1949
Province Planned Planted Area (Chungbo) a/ Area Actually Planted (Chungbo) Percentage of Area Planted Area Un-planted (Chungbo)
Seoul City 450 360 85 70
Kyonggi-do 211,240 105,620 50 105,620
Chungchong-pukto 63,450 52,029 82 11,421
335
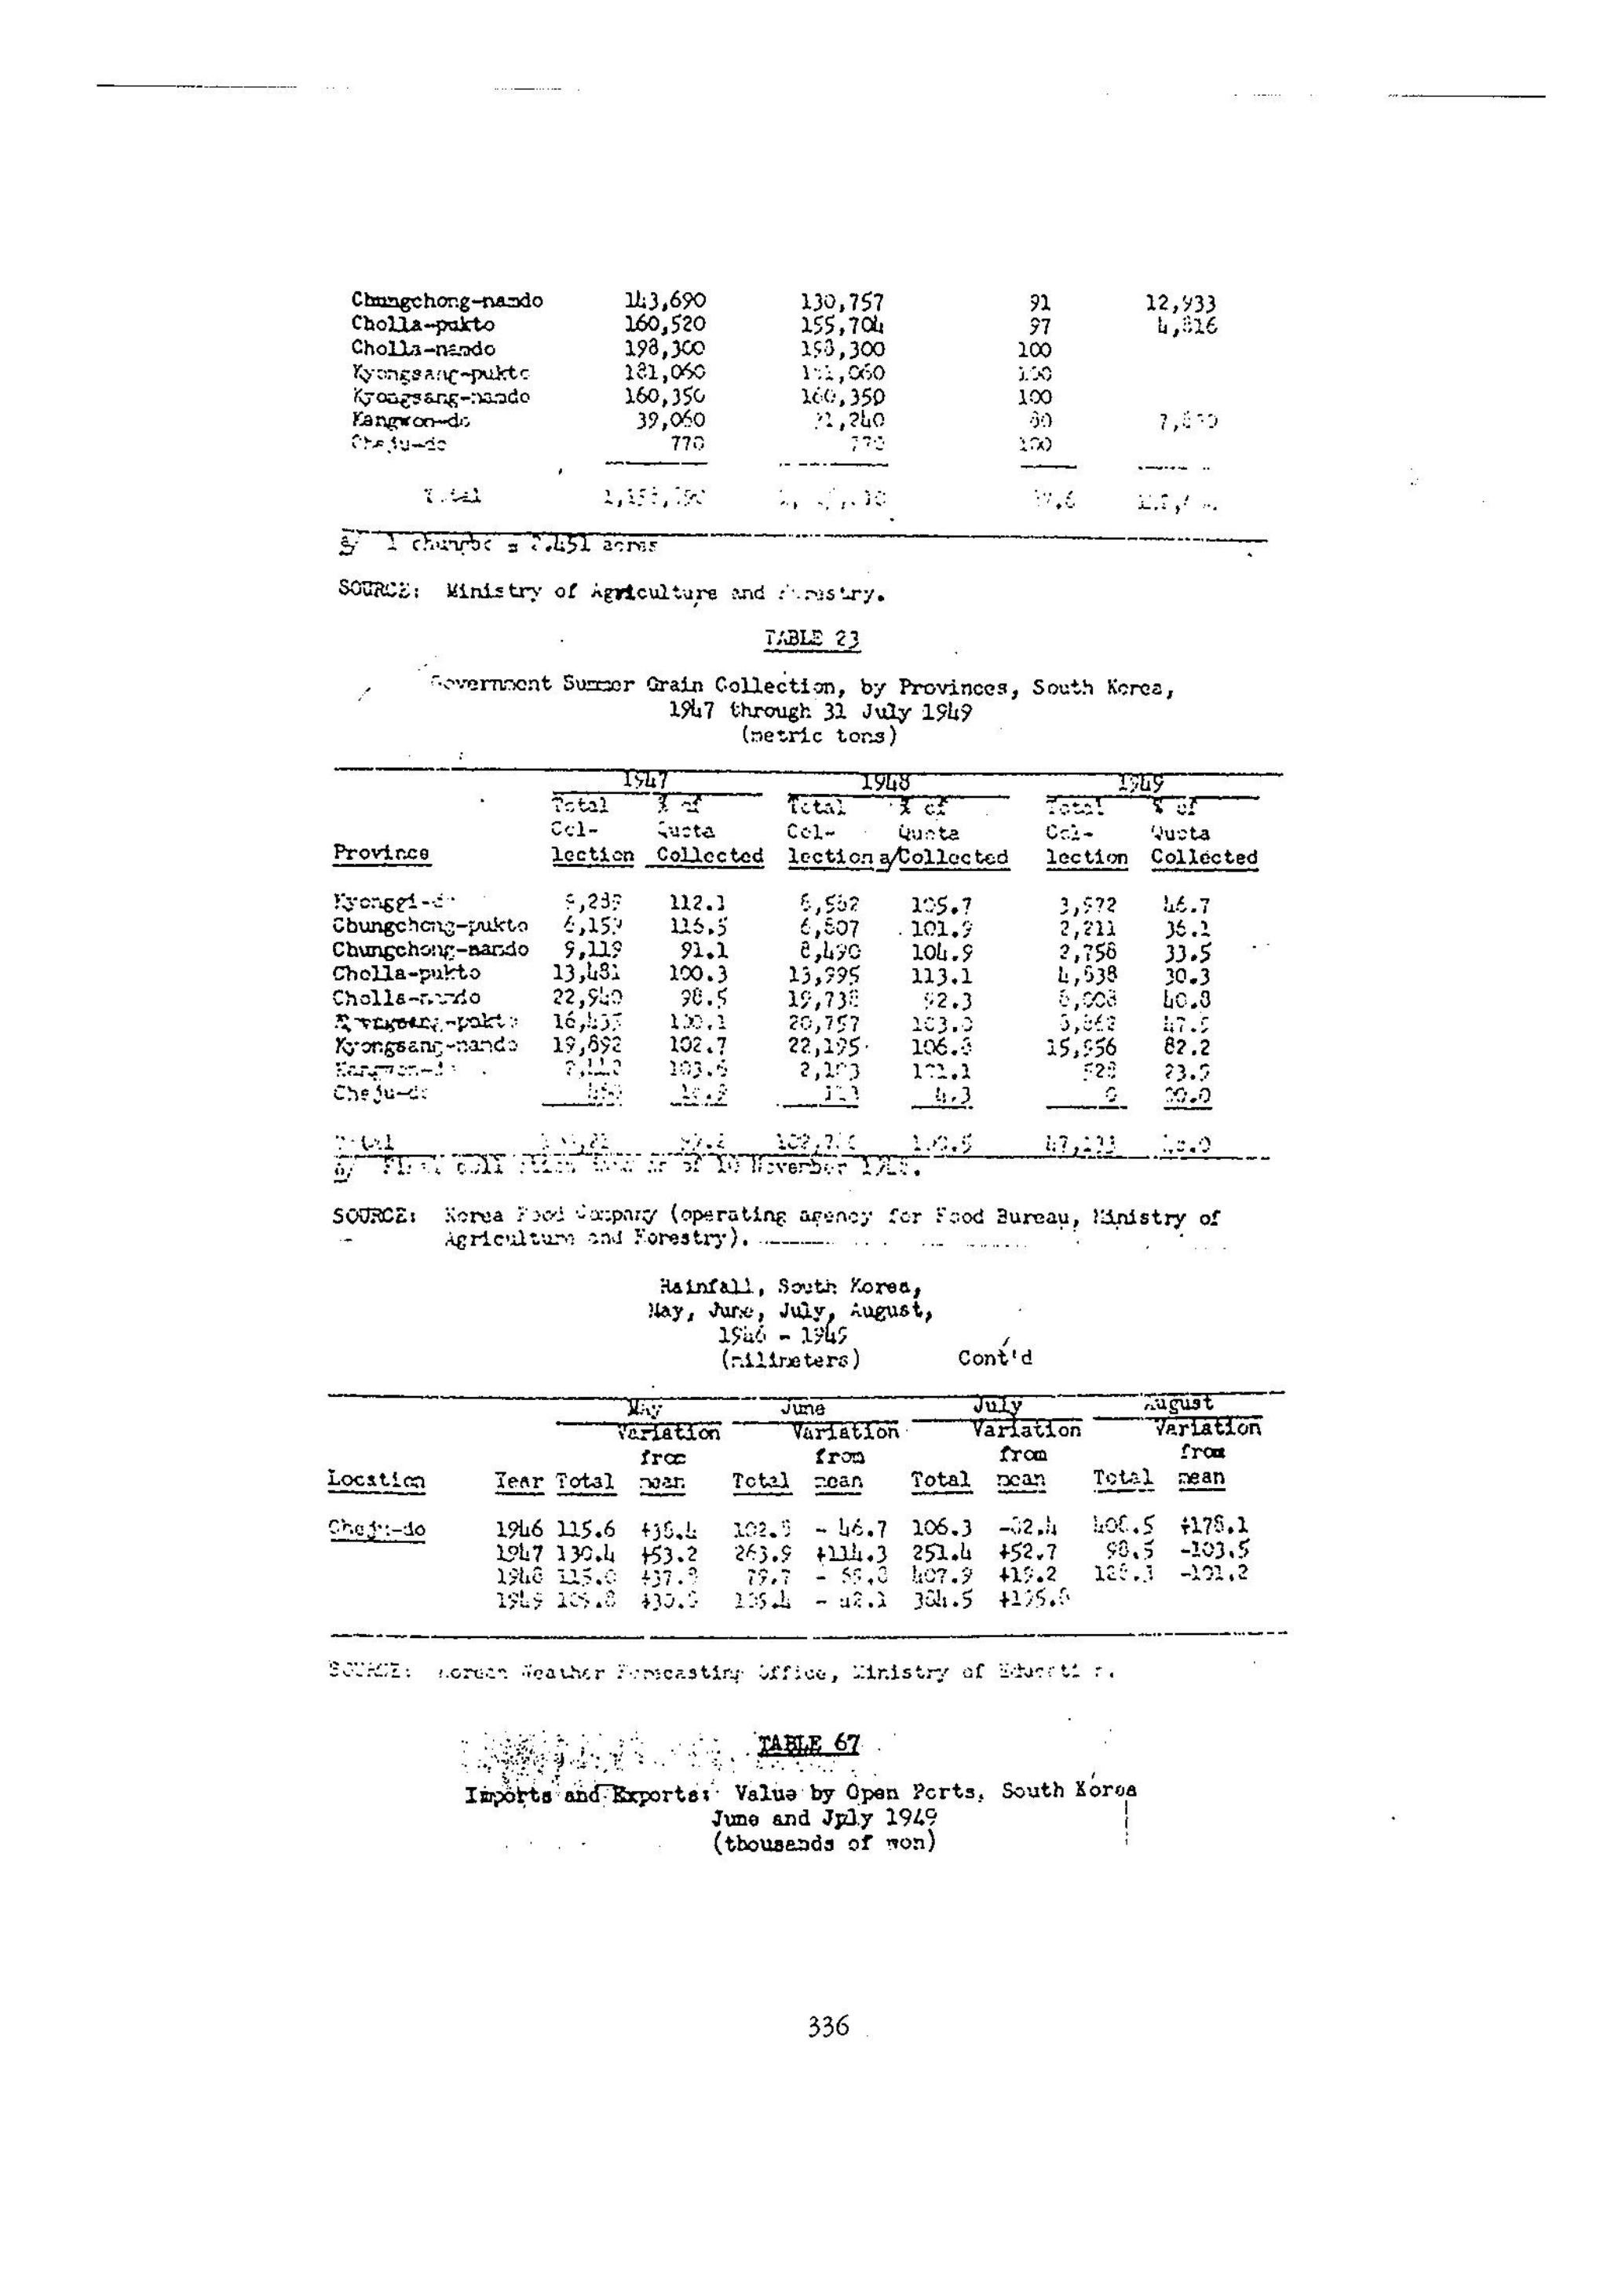
Chungchong-namdo 143,690 130,757 91 12,933
Cholla-pakto 160,520 155,704 97 4,816
Cholla-namdo 198,300 198,300 100
Kyongsang-pukto 181,060 131,060 100
Kyongsang-namdo 160,350 166,350 100
Kangwon-do 39,060 21,240 50 7,800
Cheju-do 770 770 100
Total 1,153,000 [illegible] 97.6 [illegible]
5/ 1 chungbo = 0.051 acres
SOURCE: Ministry of Agriculture and Forestry.
TABLE 23
Government Summer Grain Collection, by Provinces, South Korea,
1947 through 31 July 1949
(metric tons)
Province 1947 1948 1949
Total % of Total % of Total % of
Col- Quota Col- Quota Col- Quota
lection Collected lection a/Collected lection Collected
Kyonggi-do 5,235 112.1 6,562 105.7 3,572 46.7
Chungchong-pukto 4,159 115.5 6,507 .101.5 2,211 36.1
Chungchong-namdo 9,119 91.1 8,490 104.9 2,756 33.5
Cholla-pukto 13,481 100.3 13,995 113.1 4,538 30.3
Cholla-namdo 22,940 98.5 19,738 82.3 5,008 40.8
[illegible]-pukto 16,455 130.1 28,757 103.5 3,848 [illegible]
Kyongsang-namdo 19,692 102.7 22,195· 106.5 15,556 82.2
Kangwon-do 2,120 103.5 2,103 171.1 523 23.5
Cheju-do [illegible] [illegible] [illegible] 4.3 [illegible] 20.0
Total [illegible] 108,7[illegible] [illegible] [illegible] [illegible]
a/ First call plan: the [illegible] of 30 November 1948.
SOURCE: Korea Food Company (operating agency for Food Bureau, Ministry of Agriculture and Forestry). --------
Rainfall, South Korea,
May, June, July, August,
1946 - 1949
(millimeters)
Location May June July Cont'd August
Variation Variation Variation Variation
from from from from
Year Total mean Total mean Total mean Total mean
Cheju-do 1946 115.6 +36.4 102.3 - 46.7 106.3 -42.4 408.5 +178.1
1947 130.4 +53.2 265.9 +114.3 251.4 +52.7 98.5 -103.5
1948 115.8 +37.3 77.7 - 55.0 407.9 +41.2 128.1 -101.2
1949 109.8 +30.5 135.4 - 42.1 304.5 +125.5
SOURCE: Korean Weather Forecasting Office, Ministry of Education.
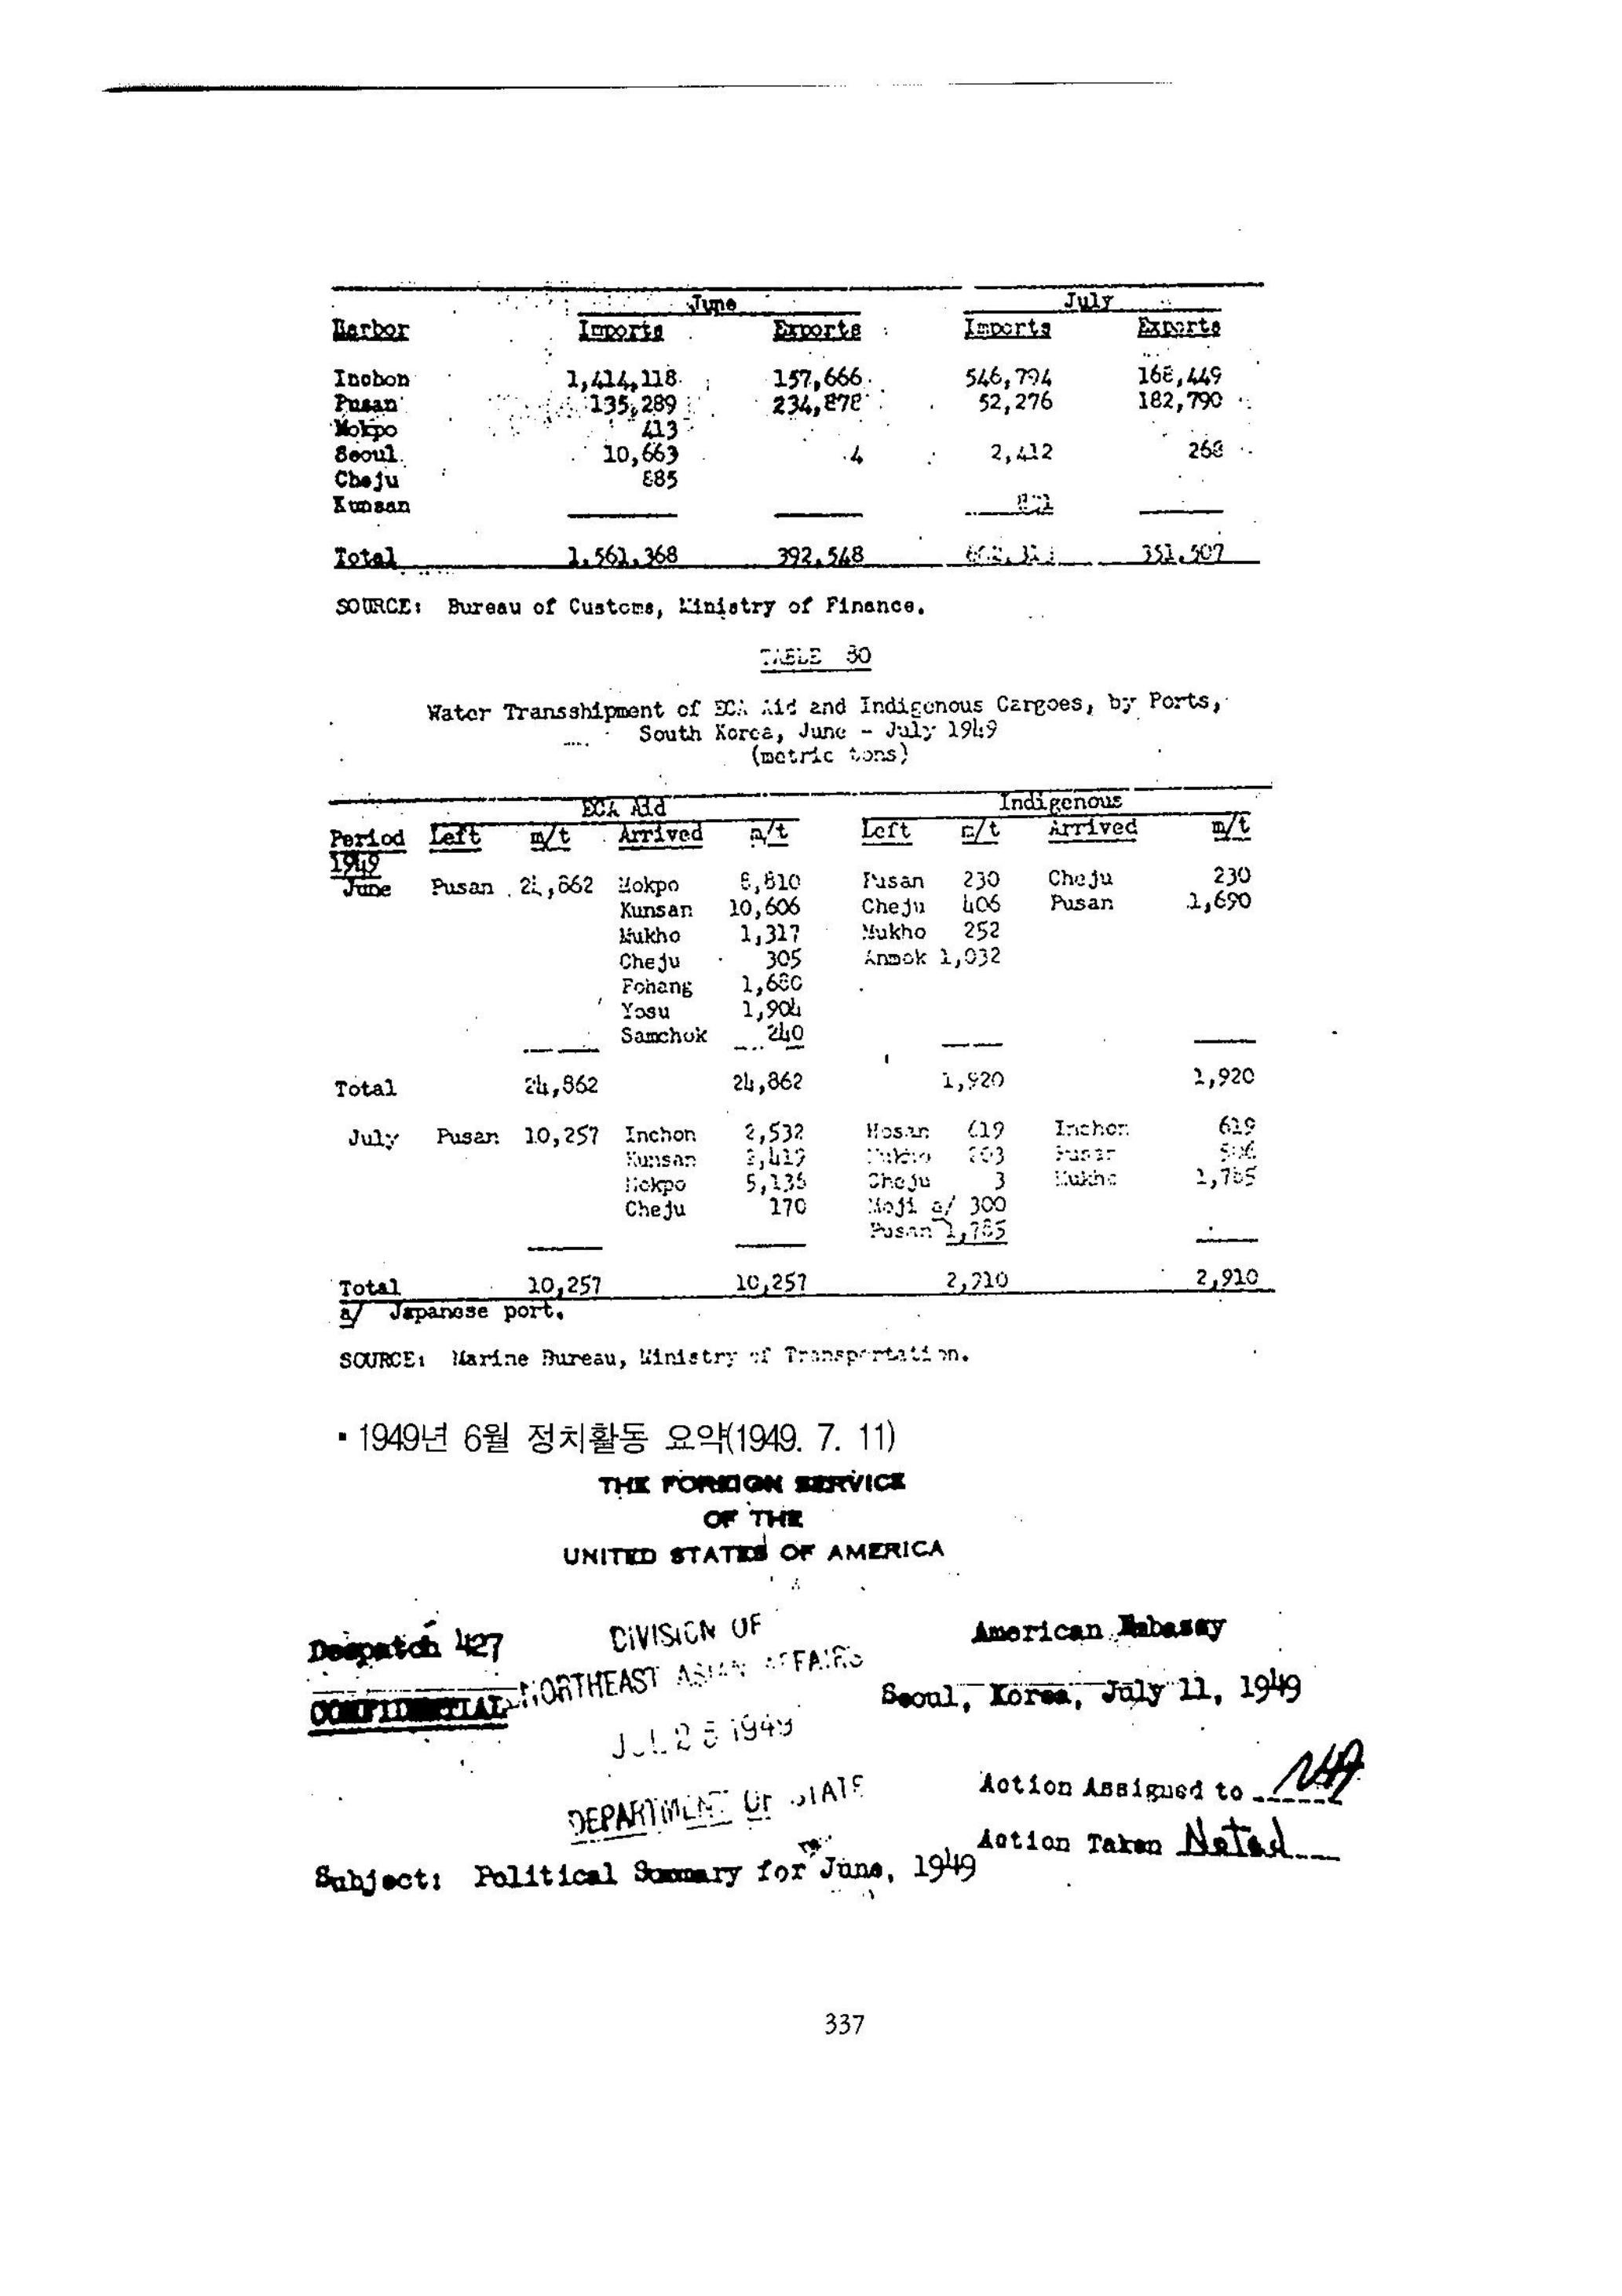
TABLE 67
Imports and Exports: Value by Open Ports, South Korea
June and July 1949
(thousands of won)
Harbor June Imports Exports July Imports Exports
Inchon 1,414,118 157,666 546,794 166,449
Pusan 135,289 234,878 52,276 182,790
Mokpo 413
Seoul 10,663 4 2,412 268
Cheju 885
Kunsan 824
Total 1,561,368 392,548 601,414 351,507
SOURCE: Bureau of Customs, Ministry of Finance.
TABLE 30
Water Transshipment of ECA Aid and Indigenous Cargoes, by Ports,
South Korea, June - July 1949
(metric tons)
ECA Aid Indigenous
Period Left m/t Arrived m/t Left m/t Arrived m/t
1949
June Pusan 21,662 Mokpo 6,810 Pusan 230 Cheju 230
Kunsan 10,606 Cheju 406 Pusan 1,690
Mukho 1,317 Mukho 252
Cheju 305 Anbok 1,032
Pohang 1,680
Yosu 1,904
Samchok 240
Total 24,862 24,862 1,920 1,920
July Pusan 10,257 Inchon 2,532 Mosan 619 Inchon 619
Kunsan 2,417 Mukho 593 Pusan 506
Mokpo 5,135 Cheju 3 Mukho 1,785
Cheju 170 Moji a/ 300
Pusan 1,725
Total 10,257 10,257 2,910 2,910
a/ Japanese port.
SOURCE: Marine Bureau, Ministry of Transportation.
출처:
제주4·3사건진상규명및희생자명예회복위원회 편,
『제주4·3사건자료집 11』 [미국자료편],
번역문 p.141
/ 원문 p.330–337.
×
![]()